

Learn How to trade with Spinning Top Pattern
Perfect Spinning Top Pattern
In this blog, we are going to see about the Spinning Top Pattern, which is one of the Japanese candlestick charting techniques. We will deeply describe the Spinning Top Pattern formation, structure, theory, and techniques to analyze and make profit with this pattern.
You will learn more about the Spinning Top Pattern in detail, which you could use in your trading technique. So read the full blog to get a better understanding of the pattern and techniques. Let’s dive into the concept.
Table of Contents
Introduction of Spinning Top Pattern

The Spinning Top Pattern is a trend reversal pattern. It is formed on the High Trend in the chart. So the prior trend should be an uptrend. If this pattern is formed in the high trend, it has the possibility that this pattern will work 70% in the market.

The Spinning Top has a small real body and a long upper and lower shadow. The upper and lower shadow must be 1.5 times longer than the Spinning Top body. That is, if the body is 1 time the size means the upper and lower shadow must be 1.5 times longer or more than the size of the body. For the bearish candle, the open price will be greater than the close price.

Structure of Spinning Top Pattern
Now let’s see how the Spinning Top Pattern structure should be formed.
Structure 1 – OLHC
This structure tells about the presence of buyers and sellers in the pattern. On the open price, the sellers pushed the price down to the low price and then the buyers took control of the market and pushed to the high price, and again the seller came in pushed a little down and closed below the open price. This structure forms like a Spinning Top in the higher timeframe.
So if this structure is formed inside the Spinning Top in the inner timeframe, the pattern has a strong possibility that it will work 80% and will give a sell signal as the market will move downside. We have to check this structure in the inner timeframe of the Spinning Top.

Structure 2 – OHLC
This structure forms like on the open price, the buyers pushed the price to the high price and then the sellers pushed to the low price, and again the buyers came in pushed a little up and closed below the open price. This structure forms like a Spinning Top in the higher timeframe. So this structure gives less possibility as that it will work in the market.

Note: We have to analyze the hanging man pattern in the higher timeframe. So you can check this pattern structure in the inner timeframe analysis. Hanging man pattern will be formed in all the time frames. It is necessary to check the pattern in a higher timeframe to analyze more and it gives more accuracy to trade.
Theory of Spinning Top Pattern
Now we will be analyzing how the market will perform in this pattern. And how to analyze and take trade with this pattern.

As you see in the above image the Spinning Top formed in the high trend. Before the pattern formed there was an uptrend. You can see that the market has full control over the buyer and reached the high price. Then the seller came in and pushed the price down and again buyer pushed the price up and close below the open price, thus forms like a Spinning Top.
This pattern should be formed in a higher timeframe. Then we can analyze this pattern in the inner timeframe to check for structure formation. If the structure is formed as we discussed above, we have a high possibility that this pattern will work in the market. So we can take a Sell Entry in the next running candle.
Confirmation of Spinning Top Pattern
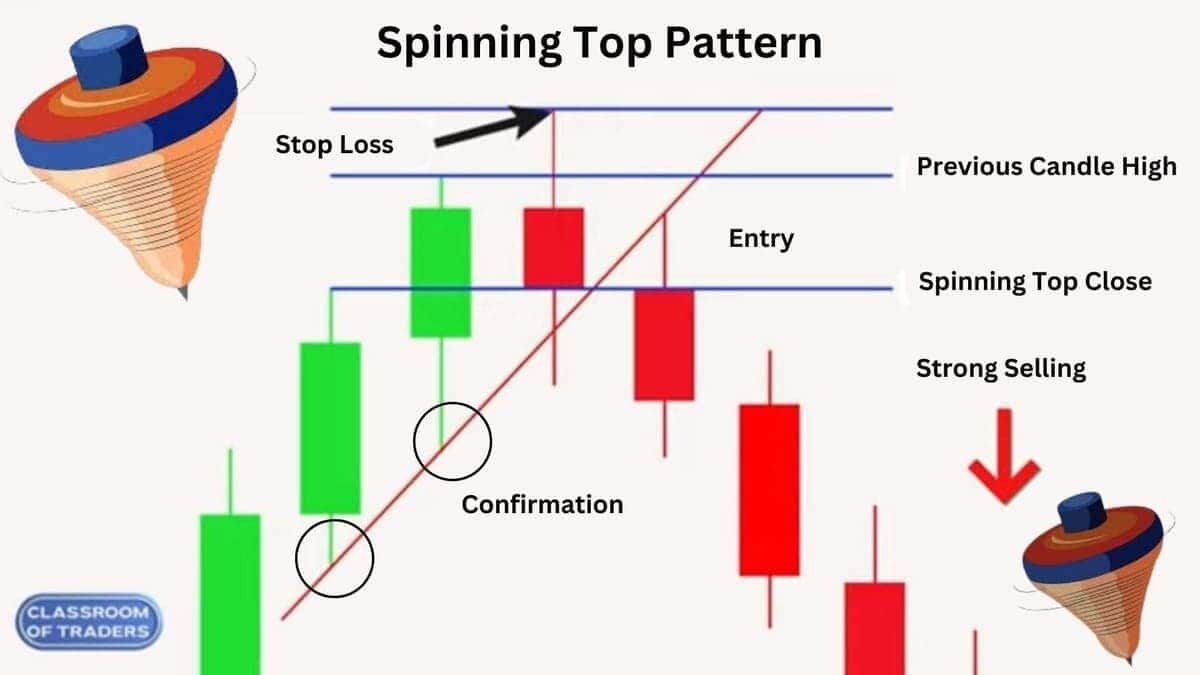
If the next candle of the Spinning Top breaks the previous support trend line, we can get confirmation that the market is going to fall. So we can short the market to make a profit.
The confirmation 1 shown in the below image, give a strong confirmation as the running candle broke and open below the support line. So it as high possibility and a strong confirmation that the market will definitely move downside.

The confirmation 2 shown in the above image, give a low confirmation as the running candle open above the support line. Here in this confirmation also the market will bearish because we have got a bearish pattern in the high trend that definitely push the market to downside.
Note: It is just a confirmation that the market will move down in a different point of view
Entry for Spinning Top Pattern
The Entry for the Spinning Top Pattern will be between the running candle open price and the previous candle high price. You can analyze in the inner timeframe to take entry in the sell range as shown below the image.

Then as shown above you can take sell entry, as the market will move downside according to our analysis.
Stop Loss for Spinning Top Pattern
The Stop Loss for Spinning Top Pattern will be the high price of the Spinning Top as shown below image in 1.

You can also keep extended stop loss as shown in above image in 2. This stop loss is strong and it has very less possibility to hit stop loss. In some cases the market has the possibility of reversal and hit the stop loss (1) and then move down. So it is most recommended to keep stop loss as shown in 2.

You can also make a Trailing Stop Loss as the market goes below by drawing a resistance line as shown in the above image.
Steps to check before taking the entry with this pattern.
Step 1: Search for the Spinning Top pattern in the higher time frame.
Step 2: Check if the pattern is in a high trend and the prior trend should be an uptrend.
Step 3: Check the Spinning Top structure –> it should be bearish –> the lower shadow should be 2 times or 3 times greater than the size of the body with perfect structure formation.
Step 4: Check the structure formation in the inner timeframe of the pattern. If you get the perfect structure move on to the next step.
Step 5: Set entry and stop loss level and execute the trade.
Step 6: Check for confirmation that the previous support line is broken, we also got confirmation that it is on a high trend, and the structure formation of the Spinning Top is perfect so the market will surely move down and we can make a huge profit.
Video Tutorials in Different Languages
Spinning Top Candlestick Pattern
A Complete Trading Guide | Video Tutorial in Tamil
Learn how to identify and trade the Spinning Top Candlestick Pattern in this comprehensive video tutorial in Tamil. Understand the structure, theory, and significance of this pattern in technical analysis. Discover how Spinning Tops signal market indecision and potential trend reversals, and how you can use them to enhance your trading strategy. Watch now to unlock the secrets of profitable trading with Spinning Top candlesticks!
Spinning Top Candlestick Pattern
A Complete Trading Guide | Video Tutorial in English
Learn how to identify and trade the Spinning Top Candlestick Pattern in this comprehensive video tutorial in English. Understand the structure, theory, and significance of this pattern in technical analysis. Discover how Spinning Tops signal market indecision and potential trend reversals, and how you can use them to enhance your trading strategy. Watch now to unlock the secrets of profitable trading with Spinning Top candlesticks
Summary of “Perfect Spinning Top Pattern”
In this blog, we delve into the Spinning Top Pattern, a popular trend reversal pattern in Japanese candlestick charting. The Spinning Top indicates market indecision, typically forming after an uptrend. It is characterized by a small real body and long upper and lower shadows, where the shadow length is at least 1.5 times the size of the body, signaling a shift in market sentiment.
We discuss the structure of the Spinning Top, focusing on two key formations:
- Structure 1 (OLHC): This structure signals a bearish trend, with a high probability (80%) of the market moving downward.
- Structure 2 (OHLC): This formation suggests a weaker probability of success, indicating less certainty in market movement.
The theory behind the Spinning Top highlights its formation after an uptrend, where sellers push prices down but buyers push back up, forming a small body. Confirmation of this pattern occurs when the next candle breaks below the support trend line, confirming a downward market movement.
Entry and Stop-Loss strategies for trading the Spinning Top involve:
- Entering a sell position between the current candle’s open price and the previous candle’s high price.
- Setting a stop-loss at the high price of the Spinning Top to protect against potential reversals.
Additionally, Trailing Stop-Loss can be used to lock in profits as the market moves in your favor.
The blog provides a step-by-step guide on identifying and trading the Spinning Top, including checking for the pattern in higher timeframes, confirming structure formation in inner timeframes, and setting appropriate entry and stop-loss levels.
Finally, the blog links to video tutorials in Tamil and English for a more comprehensive understanding of the Spinning Top Pattern and its practical application in trading strategies.
- Spinning Top Candlestick Pattern in English – A Complete Trading Guide
- Spinning Top Candlestick Pattern in Tamil – A Complete Trading Guide
By following the guidelines in this blog, traders can enhance their strategies and increase their chances of success when trading the Spinning Top Pattern.