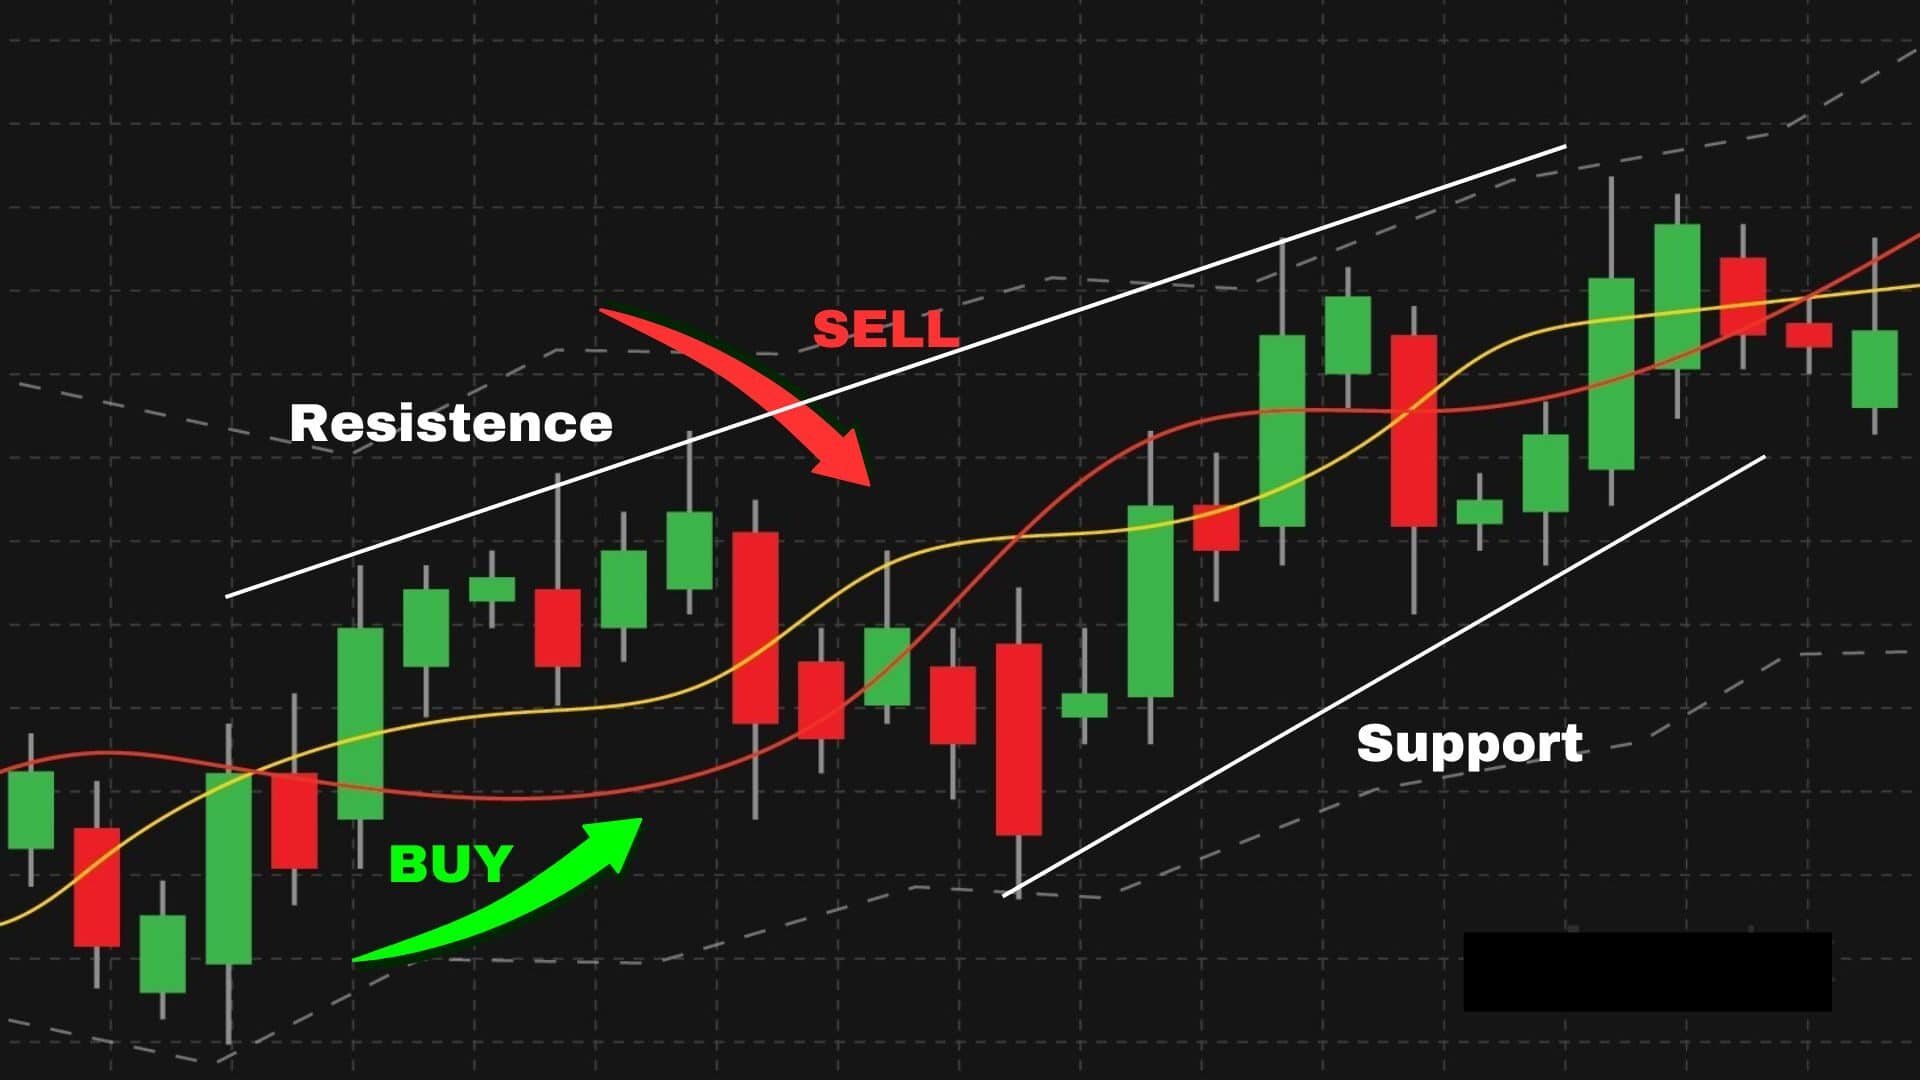
Forex-Signal-Performance-for-August-Month-CFD

Forex Signals Performance For August Month

Profit gained from Forex trading signals and earned around 50000 pips per month

We are providing Forex trading signals for different scripts and achieving 80% accuracy in the signal. The table below shows the performance data for August month of our forex trading signal. You can analyze the performance of our trading signal.

In this, we are setting the maximum loss of $12 to $25 (1000 to 2000 INR) for every script and making a profit according to the target ratio.
The overall profit upto August 15th is more than $400 which is 33500 INR.

To get the live tracking of our trading signal,👇🏻Click the below button 

NUMBER OF SIGNALS
0 +
SATISFACTION RATE
0 %
PROFITS IN USD
$ 0 +
PROFIT IN INR
Rs. 0 +

August Month CFD Signals Profit Summary

August Month CFD Signals performance

GOLD
0%
SILVER
0%
CRUDE OIL
0%
NATURAL GAS
0%
BASE METALS
0%
FOREX MARKET
0%
STOCK MARKET
0%
CRYPTOCURRENY
0%
MARKET INDICES
0%
COMMODITIES
0%

Gold Signals

$
235
/ PER MONTH
  • Buy/Sell Forex Trade Signals
  • Mobile Notifications and WhatsApp Alerts on all Signals
  • Real-Time Trade Updates
  • Free Telephone and Email Support
  • Long term and Short term Signals
  • Free onboarding lessons Via Phone or Video Conference for perfect entry and exit.

Forex Signals

$
199
/ PER MONTH
  • Buy/Sell Forex Trade Signals
  • Mobile Notifications and WhatsApp Alerts on all Signals
  • Real-Time Trade Updates
  • Free Telephone and Email Support
  • Long term and Short term Signals
  • Free onboarding lessons Via Phone or Video Conference for perfect entry and exit.

Equity Signals

$
99
/ PER MONTH
  • Buy/Sell Forex Trade Signals
  • Mobile Notifications and WhatsApp Alerts on all Signals
  • Real-Time Trade Updates
  • Free Telephone and Email Support
  • Free onboarding lessons Via Phone or Video Conference for perfect entry and exit.
  • Long term and Short term Signals
Bear Harami Pattern

Bearish Harami – Japanese Candlestick Pattern

How to analysis and Trade with Bearish Harami Pattern

In this blog, we will see about the Bearish Harami Pattern, which is one of the Japanese candlestick charting techniques. We will deeply describe the Bearish Harami Pattern formation, structure, theory, and  techniques to analyze and make profit with this pattern.

You will learn more about the Bearish Harami Pattern in detail, which you could use in your trading technique. So read the full blog to get a better understanding of the pattern and techniques. Let’s dive into the concept.

Introduction of Bearish Harami Pattern

Bear Harami Pattern
Bear Harami Pattern

The Bearish Harami Pattern is a trend reversal pattern. It is formed on the Low Trend in the chart. So the prior trend should be a downtrend. If this pattern is formed in the High trend, it has the possibility that this pattern will work 80% in the market. 

Bearish Harami is a multiple candlestick pattern. It has two candlestick formations. The first candle is a bull candle and second is a bear candle. Now if you see in the above image, the first bull candle covers the second candle body fully. So it forms like a harami candle that shows us the market is going to reverse.

Bearish Harami Pattern

If you see in the above image, there is a Spinning Top formation at the low trend. So as per the single candlestick pattern theory of Spinning Top formation, the market is going to reverse. Then we also got confirmation that there is also a bear harami pattern is formed. Overall we have strong confirmation that the market will definitely move down.

Theory of Bearish Harami Pattern

Now we will be analyzing how the market will perform in this pattern. And how to analyze and take trade with this pattern.

Theory of Bearish Harami

As you see in the above image the Bearish Harami formed in the high trend. Then you can also see that there is a Shooting Star formation. Before these patterns were formed there was an uptrend. You can see that the market has full control over the buyers and reached the high price. Then the seller pushed the market for the reversal at the resistance level. This pattern should be formed in a higher timeframe. Then we can also analyze this pattern in the inner timeframe to check for structure formation. So we can take a Sell Entry in the next running candle.

Confirmation of Bearish Harami Pattern

If the next candle of the Bearish Harami breaks the previous support trend line, we can get confirmation that the market is going to fall. So we can take a sell entry to make a profit.

Confirmation for Bearish Harami

Entry for Bearish Harami Pattern

The Entry for the Bearish Harami Pattern will be between the running candle open price and the previous candle low price by analyzing in the inner timeframe to take entry in the sell range as shown in 1.

Entry for Bearish Harami

If the pattern is formed as shown in 2, you make an entry by analyzing the inner timeframe and entry at the resistance level.

Note: For taking entry you should always analyze the 15 min or lesser timeframe. You should take an entry on the cheapest price, so you can make a huge profit.

Stop Loss for Bearish Harami Pattern

Stop Loss for Bearish Harami

The Stop Loss for Bearish Harami Pattern will be the low price of the anyone of the Bearish Harami as shown above image.

Steps to check before taking the entry with this pattern.

Step 1: Search for the Bearish Harami pattern in the higher time frame. 

Step 2: Check if the pattern is in a high trend and the prior trend should be an uptrend.

Step 3: Check whether the bear harami is formed correctly. And you also check the 2nd candle that shows any single candlestick pattern.

Step 4: Check the structure formation if any in the inner timeframe of the pattern. If you get the perfect structure move on to the next step.

Step 5: Set entry and stop loss level as discussed in theory and execute the trade.Step 6: Check for confirmation that the previous resistance line is broken, we also got confirmation that it is on a high trend, and the second candle also has a reversal pattern, so the market will surely move down and we can make a huge profit.

Conclusion

In the overall analyze, this pattern shows us the possible reversal of the trend. For more in depth understanding and learning, you can contact classroom of traders to get more knowledge in stock market trading.

To know more, Click here…

Bullish Harami Pattern

Bullish Harami Candlestick Pattern

How to analysis and Trade with Bullish Harami Pattern

In this blog, we will see about the Bullish Harami Pattern, which is one of the Japanese candlestick charting techniques. We will deeply describe the Bullish Harami Pattern formation, structure, theory, and  techniques to analyze and make profit with this pattern.

You will learn more about the Bullish Harami Pattern in detail, which you could use in your trading technique. So read the full blog to get a better understanding of the pattern and techniques. Let’s dive into the concept.

Bull Harami Pattern
Bull Harami Pattern

The Bullish Harami Pattern is a trend reversal pattern. It is formed on the Low Trend in the chart. So the prior trend should be a downtrend. If this pattern is formed in the low trend, it has the possibility that this pattern will work 80% in the market. 

Bullish Harami is a multiple candlestick pattern. It has two candlestick formations. The first candle is a bear candle and second is a bull candle. Now if you see in above image, the first bear candle covers the second candle body fully. So it forms like a harami candle that shows us the market is going to reverse.

Bullish Harami Pattern

If you see in the above image, there is a Hammer Pattern formation at the low trend. So as per the single candlestick pattern theory of hammer formation, the market is going to reverse. Then we also got confirmation that there is also a bull harami pattern is formed. Overall we have strong confirmation that the market will definitely move up.

Theory of Bullish Harami Pattern

Now we will be analyzing how the market will perform in this pattern. And how to analyze and take trade with this pattern.

Theory of Bullish Harami

As you see in the above image the Bullish Harami formed in the low trend. Then you can also see that there is a Spinning Bottom formation. Before these patterns were formed there was a downtrend. You can see that the market has full control over the seller and reached the low price. Then the buyer pushed the market for the reversal at the support level. This pattern should be formed in a higher timeframe. Then we can also analyze this pattern in the inner timeframe to check for structure formation. So we can take a Buy Entry in the next running candle.

Confirmation of Bullish Harami Pattern

If the next candle of the Bullish Harami breaks the previous resistance trend line, we can get confirmation that the market is going to rise. So we can take a buy entry to make a profit.

Confirmation for Bullish Harami

Entry for Bullish Harami Pattern

The Entry for the Bullish Harami Pattern will be between the running candle open price and the previous candle low price by analyzing in the inner timeframe to take entry in the buy range as shown in 1.

Entry for Bullish Harami

If the pattern is formed as shown in 2, you make an entry by analyzing the inner timeframe and entry at the support level.

Note: For taking entry you should always analyze the 15 min or lesser timeframe. It shows how much cheaper you can buy or sell the script according to your analysis.

Stop Loss for Bullish Harami Pattern

Stop Loss for Bullish Harami

The Stop Loss for Bullish Harami Pattern will be the low price of the anyone of the Bullish Harami as shown above image.

Trailing Stop Loss for Bull Harami

You can also make a Trailing Stop Loss as the market goes above by drawing a support line as shown in the above image.

Steps to check before taking the entry with this pattern.

Step 1: Search for the Bullish Harami pattern in the higher time frame. 

Step 2: Check if the pattern is in a low trend and the prior trend should be a downtrend.

Step 3: Check whether the Bull Harami is formed correctly. And you also check the 2nd candle that shows any single candlestick pattern.

Step 4: Check the structure formation if any in the inner timeframe of the pattern. If you get the perfect structure move on to the next step.

Step 5: Set entry and stop loss level as discussed in theory and execute the trade.

Step 6: Check for confirmation that the previous resistance line is broken, we also got confirmation that this pattern is on a low trend, and the second candle also has a reversal pattern, so the market will surely move up and we can make a huge profit.

Spinning Bottom Pattern

Spinning Bottom Candlestick Pattern

Spinning Bottom Pattern: Definition, Theory, Methodology, and Trading Setup.

In this blog, we are going to see about the Spinning Bottom Pattern, which is one of the Japanese candlestick charting techniques. We will deeply describe the Spinning Bottom Pattern formation, structure, theory, and  techniques to analyze and make profit with this pattern.

You will learn more about the Spinning Bottom Pattern in detail, which you could use in your trading technique. So read the full blog to get a better understanding of the pattern and techniques. Let’s dive into the concept.

Introduction of Spinning Bottom Pattern

Spinning Bottom Pattern
Spinning Bottom

The Spinning Bottom Pattern is a trend reversal pattern. It is formed on the Low Trend in the chart. So the prior trend should be an downtrend. If this pattern is formed in the low trend, it has the possibility that this pattern will work 70% in the market.

Body and Shadow of the Spinning Bottom

The Spinning Bottom has a small real body and a long upper and lower shadow. The upper and lower shadow must be 1.5 times longer than the Spinning Bottom body. That is, if the body is 1 time the size means the upper and lower shadow must be 1.5 times longer or more than the size of the body. For the bearish candle, the open price will be lesser than the close price.

Body and Shadow of the Spinning Bottom

Structure of Spinning Bottom Pattern

Now let’s see how the Spinning Bottom Pattern structure should be formed. 

Structure 1 – OHLC

This structure tells about the presence of buyers and sellers in the pattern. On the open price, the buyer pushed the price high price and then the sellers took control of the market and pushed to the low price, and again the buyers came in pushed a little up and closed above the open price. This structure forms like a Spinning Bottom in the higher timeframe.

So if this structure is formed inside the Spinning Bottom in the inner timeframe, the pattern has a strong possibility that it will work 80% and will give a buy signal as the market moves up. We have to check this structure in the inner timeframe of the Spinning Bottom.

Spinning Top Pattern Structure 1

This Structure shows more buying strength and the pattern forms at the low trend. So the market will definitely move upside. Then if you draw a trend line in the inner timeframe, you can analyze that the structure of this pattern will hit the resistance and support of the trend. At that support at a low price there will be a reversal pattern at the inner timeframe that pushes the market upside. Overall the analysis shows that the market will definitely move upside.

Structure 2 – OLHC

This structure forms like on the open price, the sellers pushed the price to the low price and then the buyers pushed to the high price, and again the sellers came in pushed a little down and closed above the open price. This structure forms like a Spinning Bottom in the higher timeframe. So this structure gives less possibility that it will work in the market.

Spinning Top Pattern Structure 2

Note: We have to analyze the Spinning Bottom pattern in the higher timeframe. So you can check this pattern structure in the inner timeframe analysis. Spinning Bottom pattern will be formed in all the time frames. It is necessary to check the pattern in a higher timeframe to analyze more and it gives more accuracy to trade.

Theory of Spinning Bottom Pattern

Now we will be analyzing how the market will perform in this pattern. And how to analyze and take trade with this pattern.

Theory of Spinning Bottom

As you see in the above image the Spinning Bottom formed in the low trend. Before the pattern formed there was a downtrend. You can see that the market has full control over the seller and reached the low price. Then the seller came in and pushed the price down and again buyer pushed the price up and closed above the open price, thus forms like a Spinning Bottom. This pattern should be formed in a higher timeframe.

Then we can analyze this pattern in the inner timeframe to check for structure formation. If the structure is formed as we discussed above, we have a high possibility that this pattern will work in the market. So we can take a Buy Entry in the next running candle.

Confirmation of Spinning Bottom Pattern

If the next candle of the Spinning Bottom breaks the previous resistance trend line, we can get confirmation that the market is going to rise. So we can take a buy entry to make a profit.

Confirmation of Spinning Bottom

Entry for Spinning Bottom Pattern

The Entry for the Spinning Bottom Pattern will be between the running candle open price and the previous candle low price. You can analyze in the inner timeframe to take entry in the buy range as shown below the image.

Entry for Spinning Bottom

Stop Loss for Spinning Bottom Pattern

The Stop Loss for Spinning Bottom Pattern will be the low price of the Spinning Bottom as shown below image.

Stop Loss for Spinning Bottom

You can also make a Trailing Stop Loss as the market goes above by drawing a support line as shown in the above image.

Steps to check before taking the entry with this pattern.

Step 1: Search for the Spinning Bottom pattern in the higher time frame.

Step 2: Check if the pattern is in a low trend and the prior trend should be a downtrend.

Step 3: Check the Spinning Bottom structure –> it should be bearish –> the upper and lower shadow should be 1.5 times greater than the size of the body with perfect structure formation.

Step 4: Check the structure formation in the inner timeframe of the pattern. If you get the perfect structure move on to the next step.

Step 5: Set entry and stop loss level as discussed in theory and execute the trade.

Step 6: Check for confirmation that the previous resistance line is broken, we also got confirmation that it is on a low trend, and the structure formation of the Spinning Bottom is perfect so the market will surely move down and we can make a huge profit.

Spinning Top Pattern

Learn How to trade with Spinning Top Pattern

Perfect Spinning Top Pattern

In this blog, we are going to see about the Spinning Top Pattern, which is one of the Japanese candlestick charting techniques. We will deeply describe the Spinning Top Pattern formation, structure, theory, and techniques to analyze and make profit with this pattern.

You will learn more about the Spinning Top Pattern in detail, which you could use in your trading technique. So read the full blog to get a better understanding of the pattern and techniques. Let’s dive into the concept.

Introduction of Spinning Top Pattern

Spinning Top Pattern
Spinning Top

The Spinning Top Pattern is a trend reversal pattern. It is formed on the High Trend in the chart. So the prior trend should be an uptrend. If this pattern is formed in the high trend, it has the possibility that this pattern will work 70% in the market.

Body and Shadow of the Spinning Top

The Spinning Top has a small real body and a long upper and lower shadow. The upper and lower shadow must be 1.5 times longer than the Spinning Top body. That is, if the body is 1 time the size means the upper and lower shadow must be 1.5 times longer or more than the size of the body. For the bearish candle, the open price will be greater than the close price.

Open and Close for Spinning Top

Structure of Spinning Top Pattern

Now let’s see how the Spinning Top Pattern structure should be formed. 

Structure 1 – OLHC

This structure tells about the presence of buyers and sellers in the pattern. On the open price, the sellers pushed the price down to the low price and then the buyers took control of the market and pushed to the high price, and again the seller came in pushed a little down and closed below the open price. This structure forms like a Spinning Top in the higher timeframe.

So if this structure is formed inside the Spinning Top in the inner timeframe, the pattern has a strong possibility that it will work 80% and will give a sell signal as the market will move downside. We have to check this structure in the inner timeframe of the Spinning Top.

Spinning Top Pattern Structure 1

Structure 2 – OHLC

This structure forms like on the open price, the buyers pushed the price to the high price and then the sellers pushed to the low price, and again the buyers came in pushed a little up and closed below the open price. This structure forms like a Spinning Top in the higher timeframe. So this structure gives less possibility as that it will work in the market.

Spinning Top Structure 2

Note: We have to analyze the hanging man pattern in the higher timeframe. So you can check this pattern structure in the inner timeframe analysis. Hanging man pattern will be formed in all the time frames. It is necessary to check the pattern in a higher timeframe to analyze more and it gives more accuracy to trade.

Theory of Spinning Top Pattern

Now we will be analyzing how the market will perform in this pattern. And how to analyze and take trade with this pattern.

Theory of Spinning Top

As you see in the above image the Spinning Top formed in the high trend. Before the pattern formed there was an uptrend. You can see that the market has full control over the buyer and reached the high price. Then the seller came in and pushed the price down and again buyer pushed the price up and close below the open price, thus forms like a Spinning Top.

This pattern should be formed in a higher timeframe. Then we can analyze this pattern in the inner timeframe to check for structure formation. If the structure is formed as we discussed above, we have a high possibility that this pattern will work in the market. So we can take a Sell Entry in the next running candle.

Confirmation of Spinning Top Pattern

If the next candle of the Spinning Top breaks the previous support trend line, we can get confirmation that the market is going to fall. So we can short the market to make a profit.

The confirmation 1 shown in the below image, give a strong confirmation as the running candle broke and open below the support line. So it as high possibility and a strong confirmation that the market will definitely move downside.

Confirmation For Spinning Top

The confirmation 2 shown in the above image, give a low confirmation as the running candle open above the support line. Here in this confirmation also the market will bearish  because we have got a bearish pattern in the high trend that definitely push the market to downside. 

Note: It is just a confirmation that the market will move down in a different point of view

Entry for Spinning Top Pattern

The Entry for the Spinning Top Pattern will be between the running candle open price and the previous candle high price. You can analyze in the inner timeframe to take entry in the sell range as shown below the image.

Entry for Spinning Top

Then as shown above you can take sell entry, as the market will move downside according to our analysis.

Stop Loss for Spinning Top Pattern

The Stop Loss for Spinning Top Pattern will be the high price of the Spinning Top as shown below image in 1.

Stop loss for Spinning Top

You can also keep extended stop loss as shown in above image in 2. This stop loss is strong and it has very less possibility to hit stop loss. In some cases the market has the possibility of reversal and hit the stop loss (1) and then move down. So it is most recommended to keep stop loss as shown in 2.

Trailing Stop Loss For Spinning Top

You can also make a Trailing Stop Loss as the market goes below by drawing a resistance line as shown in the above image.

Steps to check before taking the entry with this pattern.

Step 1: Search for the Spinning Top pattern in the higher time frame.

Step 2: Check if the pattern is in a high trend and the prior trend should be an uptrend.

Step 3: Check the Spinning Top structure –> it should be bearish –> the lower shadow should be 2 times or 3 times greater than the size of the body with perfect structure formation.

Step 4: Check the structure formation in the inner timeframe of the pattern. If you get the perfect structure move on to the next step.

Step 5: Set entry and stop loss level and execute the trade.

Step 6: Check for confirmation that the previous support line is broken, we also got confirmation that it is on a high trend, and the structure formation of the Spinning Top is perfect so the market will surely move down and we can make a huge profit.

Shooting Star Candlestick Pattern

What is Shooting Star Candlestick Pattern?

The Hidden Secret behind the Shooting Star Candlestick Pattern -Definition, Theory, Methodology, and Trading Setup.

In this blog, we are going to see about the Shooting Star Pattern, which is one of the Japanese candlestick charting techniques. We will deeply describe the Shooting Star Pattern formation, structure, theory, and techniques to analyze the pattern.

You will learn more about the Shooting Star Pattern in detail, which you could use in your trading technique. So read the full blog to get a better understanding of the pattern and techniques. Let’s dive into the concept.

Introduction of Shooting Star Pattern

Shooting Star Candlestick Pattern
Shooting Star

The Shooting Star Pattern is a trend reversal pattern. It is formed on the High Trend in the chart. So the prior trend should be an uptrend. If this pattern is formed in the high trend, it has the possibility that this pattern will work 70% in the market.

Long Upper Shadow Of Shooting Star
Long Upper Shadow Of Shooting Star.

It has a small real body and a long upper shadow. The body of the Shooting Star should be 3 times shorter than the upper shadow or the upper shadow must be 3 times longer than the Shooting Star body. That is, if the body is 1 time the size means the upper shadow must be 3 times longer than the size of the body. For the bearish candle, the open price will be greater than the close price.

Bearish Candle
Bearish Candle

Structure of Shooting Star Pattern

Now let’s see how the Shooting Star Pattern structure should be formed. We have different scenarios in which Shooting Star can be formed.

Different Structures of Shooting Star

The above image shows the different scenarios in which Shooting Star can be formed. We will see in detail about these patterns in the upcoming topics.

Why these 2 bullish shooting star is wrong

Bullish Shooting Star
Not a Shooting Star

These 2 bullish candles are not Shooting Star because there is buying pressure even though the seller pushed the market down. So this bullish shooting star has less probability that it will work in the market.

Why this bearish shooting star is wrong

Bearish Shooting Star

This bearish candle is not a Shooting Star pattern because the presence of the seller is low. It has the possibility that the buyer can push the market up fighting with the seller as the volume of the seller is low. As you can see, the upper shadow is only 2 times greater than the real body. The upper shadow should be more than the 3 times of the real body.

Why this bullish candle is a shooting star

Bullish Shooting Star

This bullish candle is considered a Shooting Star pattern, because as it has a bullish presence it also has a long upper shadow indicating that the seller pushed the market downside. So the market has a high probability that it will further move to the downside.

Why these 2 bearish candle is a shooting star

Bearish Shooting Star

Now these two bearish Shooting Star patterns are correct. The left side shooting star is the perfect shooting star. It forms bearish with a long upper shadow which is 3 times greater than the size of the body. It means the sellers had pushed the market downward and it will further move down due to the selling pressure.

The right side bearish candle is also a shooting star, but it is not recommended to trade with this shooting star. Because due to the very long upper shadow and the bearish body, the market already reached more selling pressure. So it has only below 50% possibility that this bearish shooting star will work in the market.

You can also check the candle formation in the inner timeframe to get strong confirmation as given in the below image.

Structure Formation of Shooting Star

If the OLHC structure is formed, it has a high probability that the pattern will work in the market. Because the formation has more selling pressure, so the market has more possibility to move downwards.

If the OHLC structure is formed, it has only 50% probability that the pattern will work in the market. Because the formation is indicating buying pressure at the close of the market.

Note: We have to analyze the Shooting Star pattern in the higher timeframe. So you can check this pattern structure in the inner timeframe analysis. Shooting Star pattern will be formed in all the time frames. It is necessary to check the pattern in a higher timeframe to analyze more and it gives more accuracy to trade.

Theory of Shooting Star Pattern

Now we will be analyzing how the market will perform in this pattern. And how to analyze and take trade with this pattern.

Theory of Shooting Star

As you see in the above image the Shooting Star formed in the high trend. Before the pattern formed there was an uptrend. You can see that the market has full control over the buyer and reached the high price. Then the seller came in and pushed the price down, thus forms like a shooting star. This pattern should be formed in a higher timeframe. Then we can analyze this pattern in the inner timeframe to check for structure formation. If the structure are formed as we discussed above, we have a high possibility that this pattern will work in the market. So we can take a Sell Entry in the next running candle.

Confirmation of Shooting Star Pattern

If the next candle of the Shooting Star breaks the previous support trend line, we can get confirmation that the market is going to fall. So we can short the market to make a profit.

Confirmation of Shooting Star

Entry for Shooting Star Pattern

The Entry for the Shooting Star Pattern will be between the running candle open price and the previous candle high price. You can analyze in the inner timeframe to take entry in the sell range as shown below the image.

Entry for Shooting Star

Then as shown above you can take sell entry, as the market will move downside according to our analysis

Stop Loss for Shooting Star Pattern

The Stop Loss for Shooting Star Pattern will be the high price of the Shooting Star

Stop loss for Shooting Star

You can also make a Trailing Stop Loss as the market goes below by drawing a resistance line as shown in the above image.

Steps to check before taking the entry with this pattern.

Step 1: Search for the Shooting Star pattern in the higher time frame.

Step 2: Check if the pattern is in a high trend and the prior trend should be an uptrend.

Step 3: Check the Shooting Star structure –> it should be bearish –> the Upper shadow should be 3 times greater than the size of the body with perfect structure formation.

Step 4: Check the structure formation in the inner timeframe of the pattern. If you get the perfect structure move on to the next step.

Step 5: Set entry and stop loss level and execute the trade.

Step 6: Check for confirmation that the previous support line is broken, we also got confirmation that it is on a high trend, and the structure formation of the Shooting Star is perfect so the market will surely move down and we can make a huge profit.

Conclusion

Finally for the shooting star pattern the target will be open. You can set according to your risk to reward ratio. The shooting star pattern will best work in the market with above explanation and trading methodology. So learn and practice more in the market to make profit with this pattern. If you want to learn with us, you can reach Classroom Of Traders.

To get detailed information about the Shooting Star Pattern, Click and watch the video 👇

Hanging Man Pattern

How To Analysis and Trade With Hanging Man Pattern

Advance Hanging man Pattern

In this blog, we are going to see about the Hanging Man Pattern, which is one of the Japanese candlestick charting techniques. We will deeply describe the Hanging Man Pattern formation, structure, theory, and techniques to analyze the pattern.

You will learn more about the Hanging Man Pattern in detail, which you could use in your trading technique. So read the full blog to get a better understanding of the pattern and techniques. Let’s dive into the concept.

Introduction of Hanging Man Pattern

Hanging Man
Hanging Man

The Hanging Man Pattern is a trend reversal pattern. It is formed on the High Trend in the chart. So the prior trend should be an uptrend. If this pattern is formed in the high trend, it has the possibility that this pattern will work 70% in the market.

Hanging Man
Hanging Man Pattern

Hanging Man has a small real body and a long lower shadow. The body of the hanging man should be 3 times shorter than the lower shadow or the lower shadow must be 3 times longer than the hanging man body. That is, if the body is 1 time the size means the lower shadow must be 3 times longer than the size of the body. For the bearish candle, the open price will be greater than the close price.

Hanging Man
Hanging Man Shadow

Note: If the candle of this pattern is in a bullish candle, it is not considered as a hanging man pattern. The reason for this will be explained in detail in the upcoming topic.

Structure of Hanging Man Pattern

Now we will see how the Hanging Man Pattern structure should be formed.

Structure 1 – OLHC

This structure tells about the presence of buyers and sellers in the pattern. On the open price, the sellers pushed the price down to the low price and then the buyers took control of the market and pushed to the high price, and again the seller came in pushed a little down and closed below the open price. This structure forms like a hanging man in the higher timeframe. So if this structure is formed inside the hanging man, the pattern has a strong possibility that it will work 80% and will give a sell signal as the market will move downside. We have to check this structure in the inner timeframe of the hanging man.

Structure 1
Structure 1

Structure 2 – OHLC

This structure forms like on the open price, the buyers pushed the price to the high price and then the sellers pushed to the low price, and again the buyers came in pushed a little up and closed below the open price. This structure forms like a hanging man in the higher timeframe. So this structure gives less possibility as that it will work in the market.

Structure 2
Structure 2

Note: We have to analyze the hanging man pattern in the higher timeframe. So you can check this pattern structure in the inner timeframe analysis. Hanging man pattern will be formed in all the time frames. It is necessary to check the pattern in a higher timeframe to analyze more and it gives more accuracy to trade.

Different scenarios in which Hanging Man can be formed.

Now we will be analyzing how the market will perform in this pattern. And how to analyze and take trade with this pattern.

Structure of Hanging Man Pattern

The above image shows the different scenarios in which hanging man can be formed. We will see in detail about these patterns in the upcoming topics.

Why these 3 Bullish Hanging Man are Wrong

Bullish Structure
Bullish Structure

These 3 bullish candles are not hanging man because there is more buying pressure in these candles. These candles are bullish and the buyers pushed the price to the high price. So these hanging man patterns have very little possibility that it will work in the market.

Why this long lower shadow Bearish hanging man is wrong

Bearish Structure
Bearish Structure

This bearish candle is considered as hanging man pattern, but it is not recommended to trade in this candle. Because in this candle the lower shadow is too long almost 4 times the real body. So the buying presence is more. If we trade in this candle the possibility is only 50% that the trade will be win or loss based on the structure that we discussed earlier.

Why this 2 hanging man are Correct

Bearish Structure
Bearish Hanging Man

Now these two bearish hanging man are perfectly formed. If these patterns are formed based on structure 1, then it has a high probability of getting the market reversed. Other than that if structure 2 is formed we can avoid that pattern as it gives less probability.

Theory of Hanging Man Pattern

Now we will be analyzing how the market will perform in this pattern. And how to analyze and take trade with this pattern.

Theory of Hanging Man

As you see in the above image the hanging man formed in the high trend. Before the pattern formed there was an uptrend. You can see that the market has full control over the buyer and reached the high price. Then the seller came in pushed the price down, but the buyers fought and pushed the price up and close below the open like a bearish candle.

This pattern should be formed in a higher timeframe. Then we can analyze this pattern in the inner timeframe to check for structure 1. If this pattern is like the formation of structure 1, we have a high possibility that this pattern will work in the market. So we can take a Sell Entry in the next running candle.

Confirmation of Hanging Man Pattern

If the next candle of the hanging man breaks the previous support trend line, we can get confirmation that the market is going to fall. So we can short the market to make a profit.

Hanging Man
Confirmation of Hanging Man

Entry for Hanging Man Pattern

The Entry for the Hanging Man Pattern will be above the running candle (that is above the next candle open price of hanging man). If the previous candle’s upper shadow is longer than the hanging man, you can take an entry as shown below in 1.

Hanging Man Entry
Entry for Hanging Man

Or If the previous candle’s upper shadow is shorter than the hanging man, you can take entry between the opening of the running candle and the previous candle high as in 2.

Then as shown above you can sell entry, as the market will move downside according to our analysis.

Stop Loss for Hanging Man Pattern

The Stop Loss for Hanging Man Pattern will be the high price of the hanging man (2) or previous candle of the hanging man (1).

Hanging man stop loss
Stop Loss for Hanging Man

You can also make a Trailing Stop Loss (1) as the market goes below by drawing a resistance line as shown in the above image.

Steps to check before taking the entry with hanging man pattern.

Step 1: Search for the Hanging man pattern in the higher time frame.

Step 2: Check if the pattern is in a high trend and the prior trend should be an uptrend.

Step 3: Check the Hanging man structure –> it should be bearish –> the lower shadow should be 2 times or 3 times greater than the size of the body with perfect structure formation.

Step 4: Check the structure formation in the inner timeframe of the pattern. If you get the perfect structure move on to the next step.

Step 5: Set entry and stop loss level and execute the trade.

Step 6: Check for confirmation that the previous support line is broken, we also got the confirmation that it is on a high trend, and the structure formation of the hanging man both are perfect so the market will surely move down and we can make a huge profit.

Classroom Of Traders Live Trading in YouTube

Classroom Of Traders Live Trading in YouTube

Classroom Of Traders Live Trading in YouTube

We are Happy to announce that we have started our live trading on Classroom of Traders YouTube channel. We are doing a live trading session on how to make consistent profit in the forex market with our strategy.  

We are making consistent profit in the demo trading account of $10,000. We have started trading from 29/08/2024. Trader name is Fredrick – Senior Research Analyst

❌Disclaimer: Stock market trading carries risks and may not be suitable for everyone. Our content is educational and not financial advice. Always conduct your research and seek advice from professionals before investing.

Do watch our live trading on how to make consistent profit. If you want to know more about the strategy, you can contact Classroom of Traders.

Live Streaming – 14

This live is on 04/11/2024. We made $32343 profit since started, that is almost 323% of the capital with our consistent profit making strategy. You can watch our live on YouTube. Click below to watch.👇🏻

Gold Live Trading on November 4th 2024

Live Streaming – 13

This live is on 25/10/2024. We made $27068 profit since started, that is almost 270% of the capital with our consistent profit making strategy. You can watch our live on YouTube. Click below to watch.👇🏻

Live Streaming – 12

This live is on 24/10/2024. We made $25851 profit since started, that is almost 258% of the capital with our consistent profit making strategy. You can watch our live on YouTube. Click below to watch.👇🏻

🔴LIVE XAUUSD FOREX TRADING – CLASSROOM OF TRADERS ACCOUNT LIVE STREAMING

Live Streaming – 11

This live is on 18/10/2024. We made $16990 profit since started, that is almost 169% of the capital with our consistent profit making strategy. You can watch our live on YouTube. Click below to watch.👇🏻

LIVE XAUUSD FOREX TRADING – CLASSROOM OF TRADERS ACCOUNT LIVE STREAMING

Live Streaming – 10

This live is on 14/10/2024. We made $14390 profit since started, that is almost 140% of the capital with our consistent profit making strategy. You can watch our live on YouTube. Click below to watch.👇🏻

LIVE XAUUSD FOREX TRADING – CLASSROOM OF TRADERS FOREX ACCOUNT LIVE STREAMING

Live Streaming – 9

This live is on 11/10/2024. We made $14390 profit since started, that is almost 140% of the capital with our consistent profit making strategy. You can watch our live on YouTube. Click below to watch.👇🏻

XAUUSD LIVE FOREX TRADING – CLASSROOM OF TRADERS FOREX ACCOUNT LIVE STREAMING

Live Streaming – 8

This live is on 03/10/2024. We made $6195 profit since started, that is almost 61% of the capital with our consistent profit making strategy. You can watch our live on YouTube. Click below to watch.👇🏻

XAUUSD LIVE FOREX TRADING – CLASSROOM OF TRADERS FOREX ACCOUNT LIVE STREAMING

Live Streaming – 7

This live is on 24/08/2024. We made $5453 profit since started, that is almost 54% of the capital with our consistent profit making strategy. You can watch our live trading in YouTube. Click below to watch.👇🏻

XAUUSD LIVE FOREX TRADING – CLASSROOM OF TRADERS FOREX ACCOUNT LIVE STREAMING

Live Streaming – 6

This live is on 23/08/2024. We made $4705 profit since started, that is almost 47% of the capital with our consistent profit making strategy. You can watch our live trading in YouTube. Click below to watch.👇🏻

XAUUSD LIVE FOREX TRADING – CLASSROOM OF TRADERS FOREX ACCOUNT LIVE STREAMING

Live Streaming – 5

This live is on 19/08/2024. We made $4064 profit since started, that is almost 40% of the capital with our consistent profit making strategy. You can watch our live trading in YouTube. Click below to watch.👇🏻

XAUUSD LIVE FOREX TRADING – CLASSROOM OF TRADERS FOREX ACCOUNT LIVE STREAMING

Live Streaming – 4

This live is on 12/08/2024. We made $3641 profit since started, that is almost 36% of the capital with our consistent profit making strategy. You can watch our live trading in YouTube. Click below to watch.👇🏻

XAUUSD LIVE FOREX TRADING – CLASSROOM OF TRADERS FOREX ACCOUNT LIVE STREAMING

Live Streaming – 3

This live is on 04/08/2024. We made $1725 profit within 5 days, that is almost 17% of the capital with our consistent profit making strategy. You can watch our live trading in YouTube. Click below to watch.👇🏻

XAUUSD LIVE FOREX TRADING – CLASSROOM OF TRADERS FOREX ACCOUNT LIVE STREAMING

Live Streaming – 2

This live is on 03/08/2024. We made $830 profit within 3 days, that is almost 3% of the capital with our consistent profit making strategy. You can watch our live trading in YouTube. Click below to watch.👇🏻

XAUUSD LIVE FOREX TRADING – CLASSROOM OF TRADERS FOREX ACCOUNT LIVE STREAMING

Live Streaming – 1

We are Happy to announce that we have started our live trading on Classroom of Traders YouTube channel. We are doing a live trading session on how to make consistent profit in the forex market with our strategy.  

This live is on 02/08/2024. We made $386 profit within 3 days, that is almost 3% of the capital with our consistent profit making strategy. You can watch our live trading in YouTube. Click below to watch.👇🏻

XAUUSD LIVE FOREX TRADING – CLASSROOM OF TRADERS FOREX ACCOUNT LIVE STREAMING

Conclusion:

We are showing the live proof that we are making consistent profit from our strategy. If you want to know and learn about our consistent profit making strategy, you can contact Classroom of Traders.

Coinrule

Best Automated Crypto Trading Bot- Coinrule

Introduction

CoinRule
CoinRule

Coinrule is a creative platform that allows users to create automated trading strategies across multiple exchanges through a user-friendly interface and a range of indicators that users can use to pre-plan their crypto trading.

There is no need for users to sit in front of charts for hours with Coinrule because there are no coding skills required. Anyone can use it.

Features of Coinrule

Automated trading

Coinrule provides users with the ability to execute trades automatically based on predefined conditions as well as the option to trade manually.

Pricing

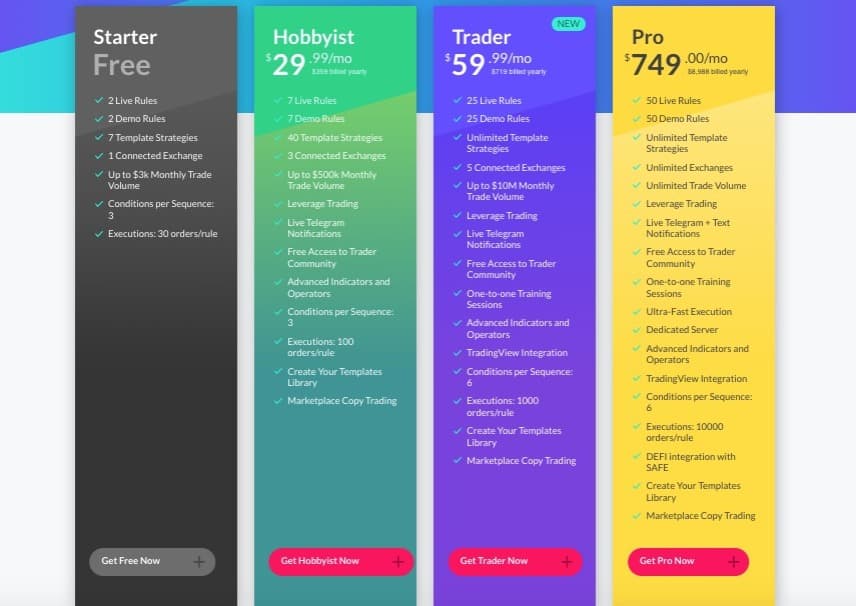
The coinrule offers four pricing plans such as Starter, Hobbyist, Trader, and Pro.

Strategy Templates

The Strategy Templates are pre-defined and it is created by experienced traders based on popular trading strategies so users can set buy and sell orders based on market conditions.

Customizable Rules

The coinrule allows users to customize their own strategies and rules to trade in the cryptocurrency market.

Mobile App

Risk Management

A risk management strategy is a set of practices that every trader or investor needs to follow to minimize the overall risk of the positions they are taking daily.

Automated Trading Rules

Coinrule
Automated Rules Across Coins

It allows users to create custom trading rules and it also allows the users to create automated rules across coins.

Automatic Crypto Bot

The Coinrule is a platform that is useful for a wide variety of traders. It offers a wide range of opportunities for users to plan their trading system and buy and sell NEM easily and automatically. Users can test and develop their automatic strategies to purchase and sell NEM automatically as they like.

Pricing

Coinrule offers four pricing and plans

pricing and plans
Four pricing and plans

1. Starter

In coinrule offers, the starter plan fully free. It allows users to access 2 live rules, 2 demo rules,7 template strategies, 1 connected exchange, and some more offers.

2. Hobbyist

The Hobbyist pricing plan offers users to access 7 live rules, 7 demo rules, 40 template strategies, 3 connected exchanges, up to $ 500k monthly trade volume, leverage trading, and some more offers.

3. Trader

The Trader pricing plan offers users to access 25 live rules, 25 demo rules, unlimited template strategies, 5 connected exchanges, up to $ 10M monthly trade volume, leverage trading, live telegram notifications, free access to the trader community, and some more offers.

4. Pro

The pro pricing plan offers users to access 50 live rules, 50 demo rules, unlimited template strategies, unlimited exchanges, unlimited trade volume, leverage trading, live telegram + text notifications, free access to the trader community, ultra-fast execution dedicated server trading view integration, and some more offers.

Acknowledgment

Users need to pay attention to the terms of use as they provide, very important information about the users’ rights and obligations, as well as conditions, limitations, and exclusions, and should be read carefully before accessing or using the Software. By using this Software in any way and for any purpose, with or without an account, and from any device and location, users need to accept and acknowledge that.

Pros and cons

Pros

  • Free plan available
  • Demo Exchange
  • Pre-Built Templates
  • User friendly
  • Users can Customizable Rule
  • Automated trading

Cons

  • Limitations for free
  • Learning Curve

Conclusion

The Coinrule is software that allows users to create automated trading strategies across multiple exchanges. It offers four types of pricing and planning. By using this software users do not need to sit and watch the charts for hours. It is a user-friendly software and it is also available in a mobile app(Coinrule Crypto Trading Bot).

To check out the Coinrule, Click here.


Wirex Card

Wirex Card – The best Cryptocurrency and Bitcoin Wallet

Introduction

Wirex card

As a digital payment provider, Wirex can accept transactions with more than 100 currencies and 30 cryptocurrencies. As well as offering competitive exchange rates, they offer a multi-currency rewards debit card that can be used worldwide.

What is wirex?

Wirex
Wirex

Wirex Card is a debit card that lets you spend money directly from your Wirex account. The Wirex company, previously known as E-Coin, was founded in 2014 and has been providing traditional and cryptocurrencies to people around the world for many years to make them more accessible.

In addition to making exchanging fiat and crypto simple and affordable, it also offers a cryptocurrency rewards debit card that allows you to earn crypto back for every purchase you make.

The Wirex card is a debit card or credit card?

This Card is a debit card that allows you to spend money directly from your Wirex account, which includes both cryptocurrency and traditional fiat currency. As it uses your funds, it does not offer credit cards. However, if you prefer not to spend your cryptocurrency holdings, it offers a loan option. There are two types of this card a physical one as well as a virtual one.

Physical and virtual Wirex cards

Wirex
Physical and Virtual Wirex Cards

Physical card

The physical cards are payment cards that are made from plastic or metal and are used to make purchases by the cardholders.

How do get a Physical card?

Step 1: Open the wirex app and log in to that.

Step 2: Navigate to the cards section.

Step 3: To get a physical card Select the “Physical” card from the carousel and click Get Physical Card.

Step 4: Accept the terms and conditions.

Step 5: If necessary, ensure that there is sufficient funding to top up the account.

Step 6: Fill in your right delivery address and choose the option(Standard or Express)delivery.

Step 7: Choose the account to pay the delivery fee and confirm your order.

virtual card

The virtual cards on your phone work exactly like the physical cards you have on hand — they just reside in your digital wallet rather than your physical wallet. Secured by encryption, they are an easy and safe way to pay online and in-store.

How do get a virtual card?

Step 1: Open the wirex app on your smartphone and login into it.

Step 2: Select the option Virtual card.

Step 3: Click the option Get Virtual card.

Step 4: Accept the terms and conditions.

Step 5: Fill your account if required.

The Virtual cards are instantly available in the app.

Advantages and disadvantages

Advantages

  • Traders can trade cryptos with low fees and there is no commission charged on fiat-to-fiat transactions.
  • There are nine fiat currencies supported by this service, which can be sent, received, exchanged, and spent.
  • It offers free multicurrency exchange and zero exchange fees.
  • The FCA, the Bank of Lithuania, and the MAS are all involved in the regulation of Wirex.
  • There are two versions of the Wirex application, one for Android phones and one for iOS phones.

Disadvantages

  • The customer support is slow.
  • No demo Account.
  • It does not offer charts and indicators to cater to technical analysis.
  • Shortage of advanced crypto trading tools.

Which countries are eligible for Wirex?

In addition to Europe and Asia Pacific, the platform supports several other countries.

Wirex offers services in the following countries: UK, France, Spain, Portugal, Germany, Italy, Poland, Czeck, Slovakia, Austria, Norway, Sweden, Denmark, the Netherlands, Romania, Australia, Hong Kong, New Zealand, the Philippines, Singapore, Taiwan, and Thailand.

Is it possible to use Wirex in India?

Wirex Card is accepted at over 61 million locations worldwide, where Visa and Mastercard are accepted.

Conclusion

Users can exchange fiat and cryptocurrencies as well as buy, sell, send, spend, and store them with this simple interface. With low fees and a strong emphasis on security, it is ideal for individuals looking to exchange and spend both fiat and cryptocurrencies. As a crypto platform, Wirex is a good choice for both existing investors and those who are just getting started.

To check the wirex card, Click here.

Mindful Trader

Mindful Trader – Best Trading Alert

As a swing trader, if you want to improve your trading strategies and make more informed decisions, then mindful trading will be a huge help to you. Whether you are a newbie or a skilled trader, the mindful trader will give you all the information you need to make an informed decision when trading.

Introduction

The Mindful Trader provides daily stock picks based on backtested trading strategies that have been tested using historical data.

This is one of the best stock market trading alert services. It provides trading signals for stocks, options, and futures based on statistical research and focuses particularly on swing traders.
The service has regularly produced annual returns in the triple digits for its data-driven approach.

What Is Swing Trading?

Swing Trading
Swing Trading

Trading strategy that aims to capture price swings or fluctuations in the market to benefit from short- to medium-term price movements with positions typically held between a few days and a few weeks to capture price swings or fluctuations in the market.

Features of the Mindful Trader

Technical Analysis

  • It is a platform offers several technical analysis tools, including RSI, MACD, and moving averages, which can be used to help traders identify potential entry and exit points for the market.

Real Time Alerts

  • It gives real-time alerts.

Market Sentiment

  • To understand market sentiment, sentiment analysis tools can be used that provide insights into the collective mood of traders on a given day.

Risk Management

  • As an emphasis on risk management, it allows traders to set stop-loss orders and effectively manage their risks.

Pros and cons  

Pros

  • User-friendly interface
  • Strong technological research tools
  • Real-time trade alerts
  • Market view analysis
  • Practical risk management elements
  • You can discontinue the service at any time.

Cons

  • premium required for all access.
  • May be too pricey for beginners.
  • Non-refundable first-month fees.

Who is Mindful Trader Best for?

Busy Individuals

It analyzes the individual stock markets and provides stock alerts so you can make informed decisions quickly without having to pore over charts and data.

Data-Driven Investors

It uses algorithms and backtesting to determine the best setups and entry points based on hard numbers rather than gut feelings.

Learning Traders

The Mindful Trader is an education tool too. Eric explains the trading strategies and makes it a great learning tool, specifically for beginners.

Swing Traders

For those who want to make a profit from short to medium-term market moves the mindful trader is the best choice.

Conclusion

A thorough analysis of  it shows that it is an excellent service for swing traders who want to leverage data and analytics to make smarter, more risk-managed trades. However, It may not be suitable for long-term investors or day traders.

A swing trade typically lasts between 3 and 15 trading days, which means it’s not ideal for long-term investors or intraday traders. A mindful Trader is a good option for swing traders looking to improve their trading skills.

To check the mindful trader, Click here.