
Bearish Harami – Japanese Candlestick Pattern
How to analysis and Trade with Bearish Harami Pattern
In this blog, we will see about the Bearish Harami Pattern, which is one of the Japanese candlestick charting techniques. We will deeply describe the Bearish Harami Pattern formation, structure, theory, and techniques to analyze and make profit with this pattern.
You will learn more about the Bearish Harami Pattern in detail, which you could use in your trading technique. So read the full blog to get a better understanding of the pattern and techniques. Let’s dive into the concept.
Table of Contents
Introduction of Bearish Harami Pattern

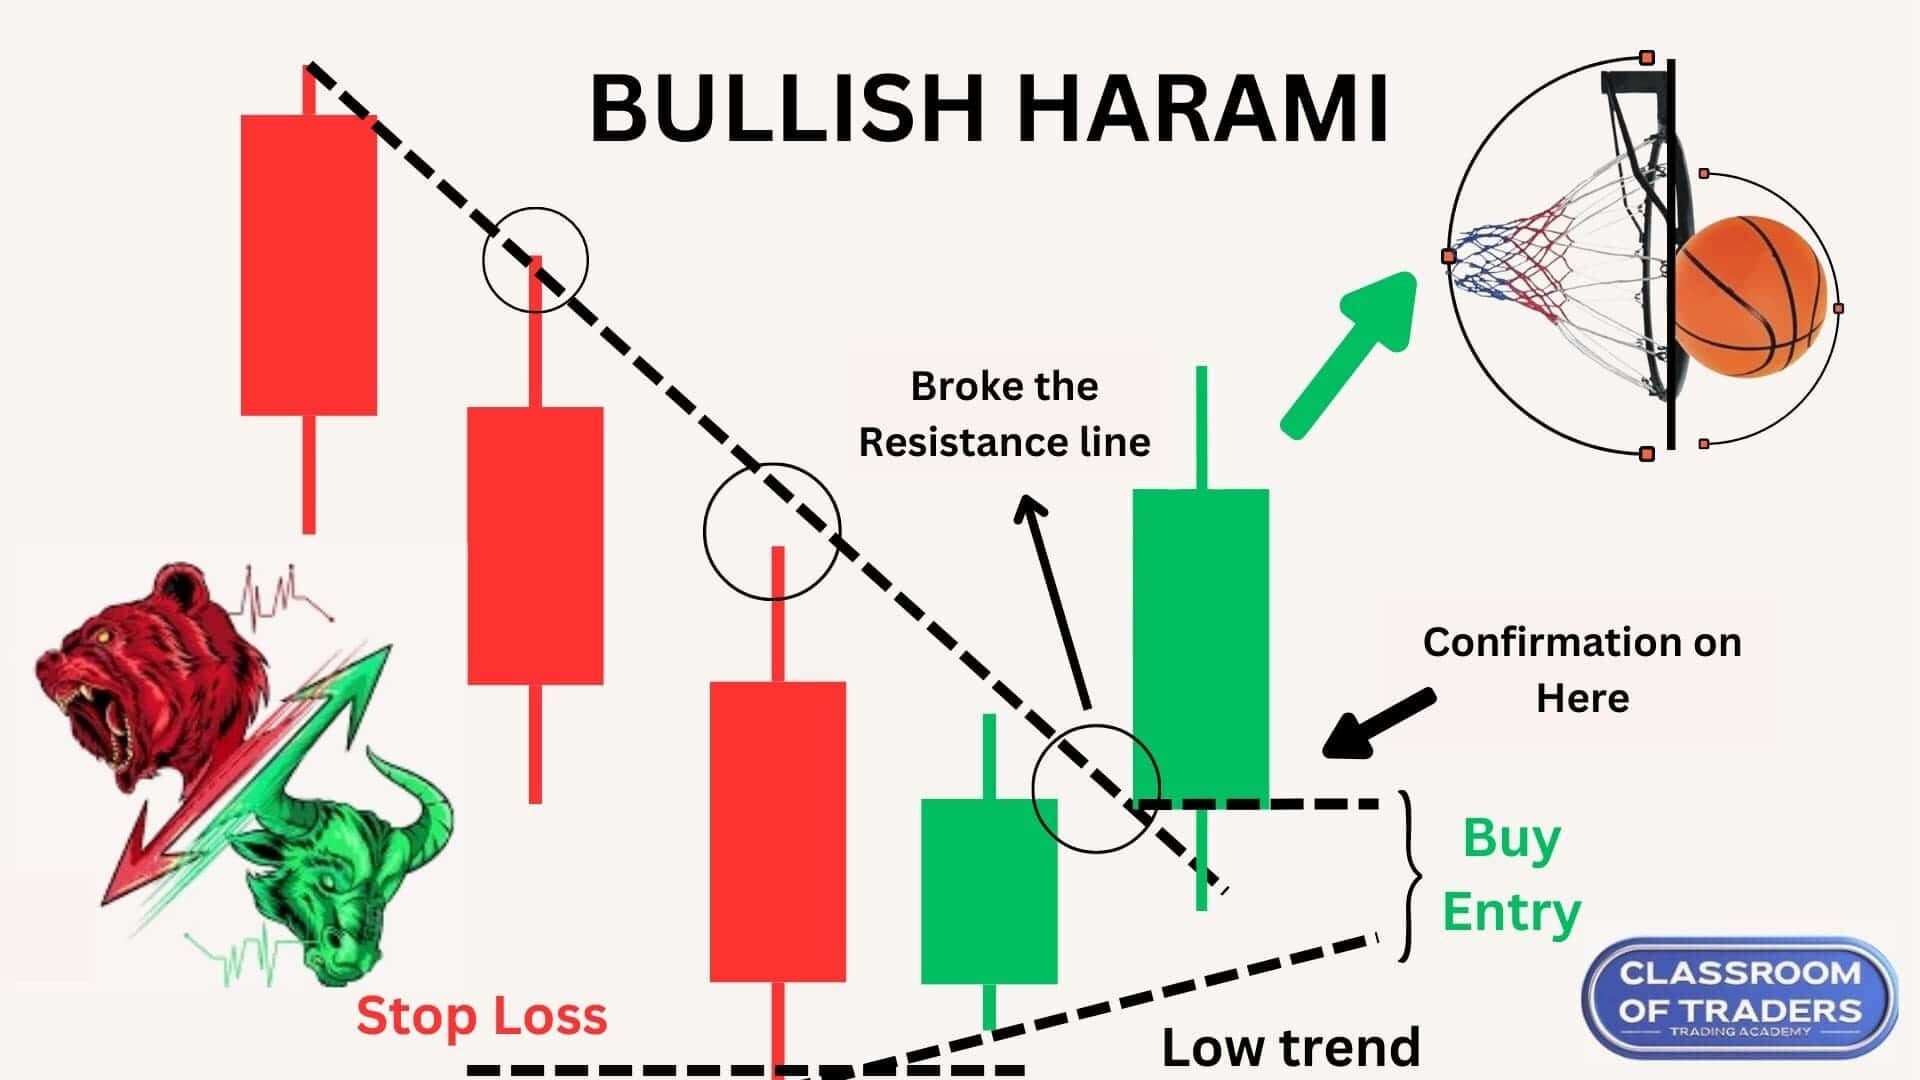
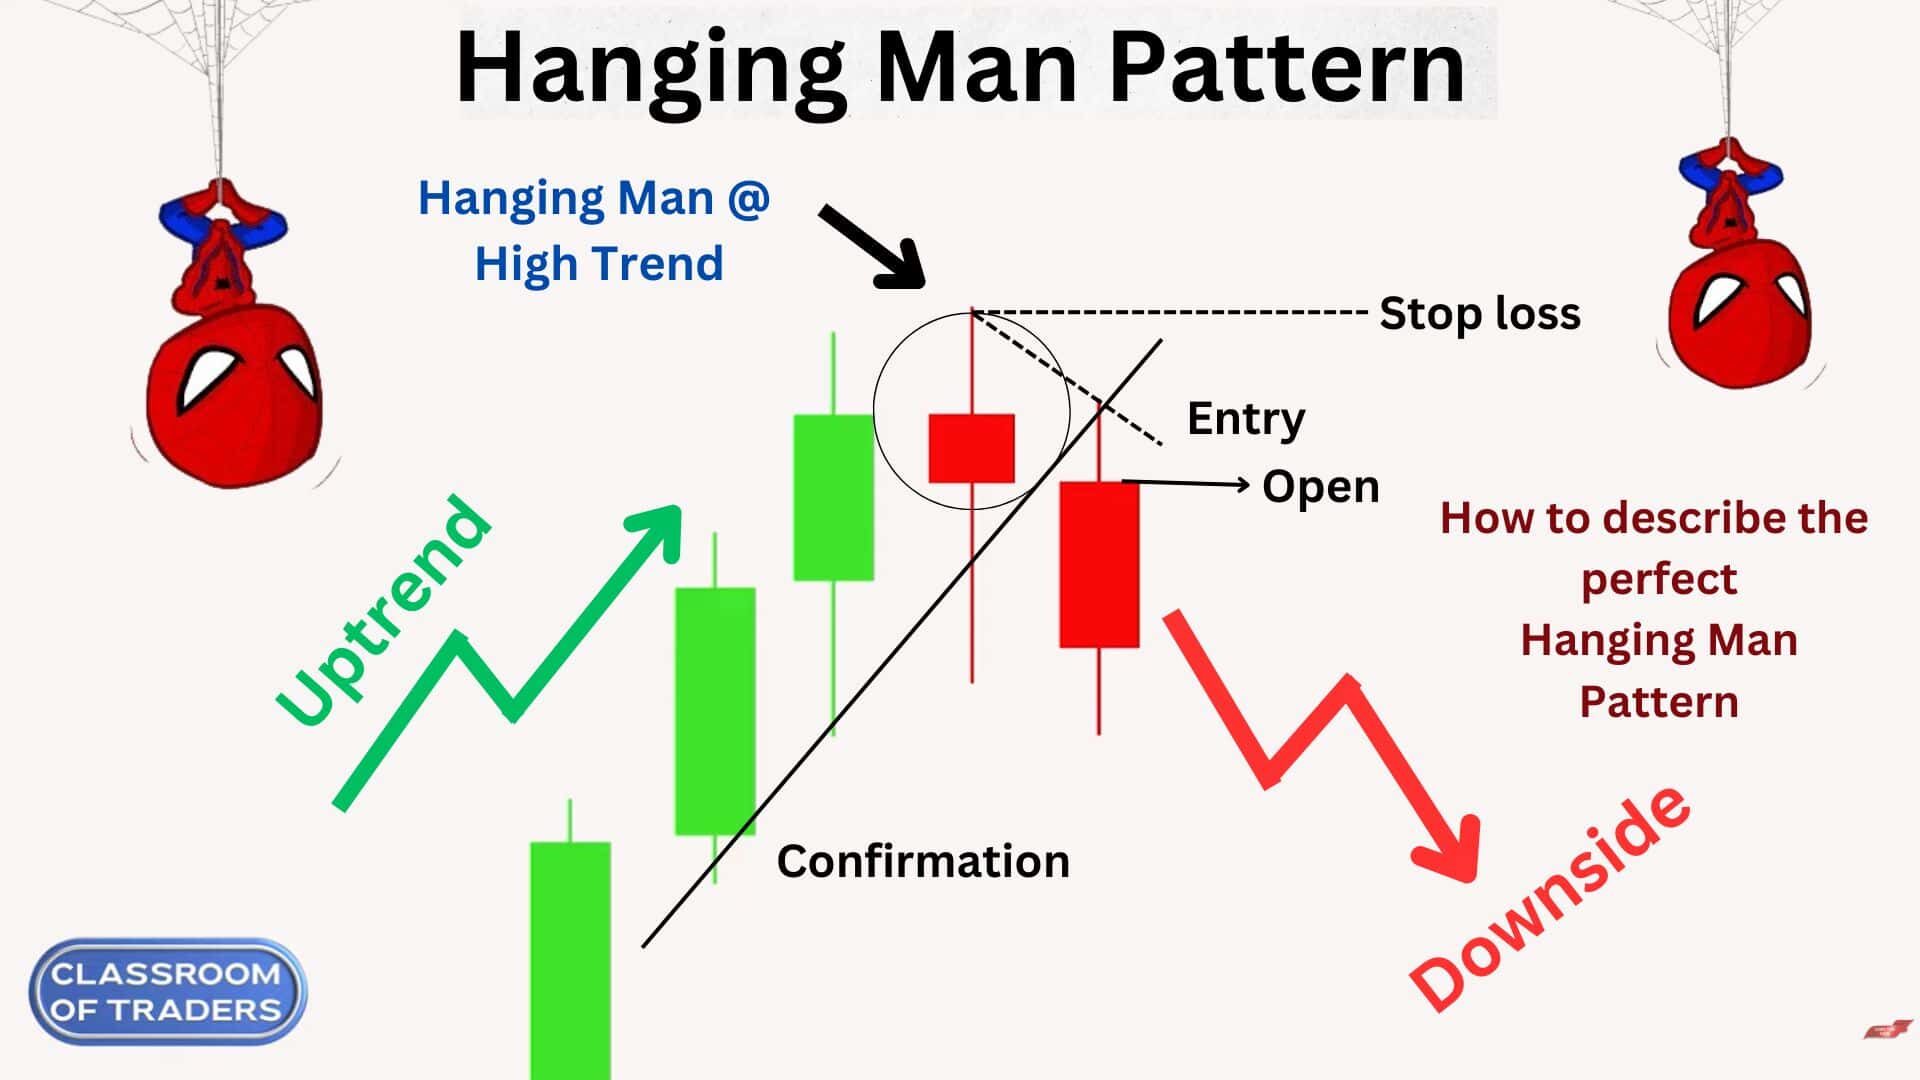
The Bearish Harami Pattern is a trend reversal pattern. It is formed on the Low Trend in the chart. So the prior trend should be a downtrend. If this pattern is formed in the High trend, it has the possibility that this pattern will work 80% in the market.
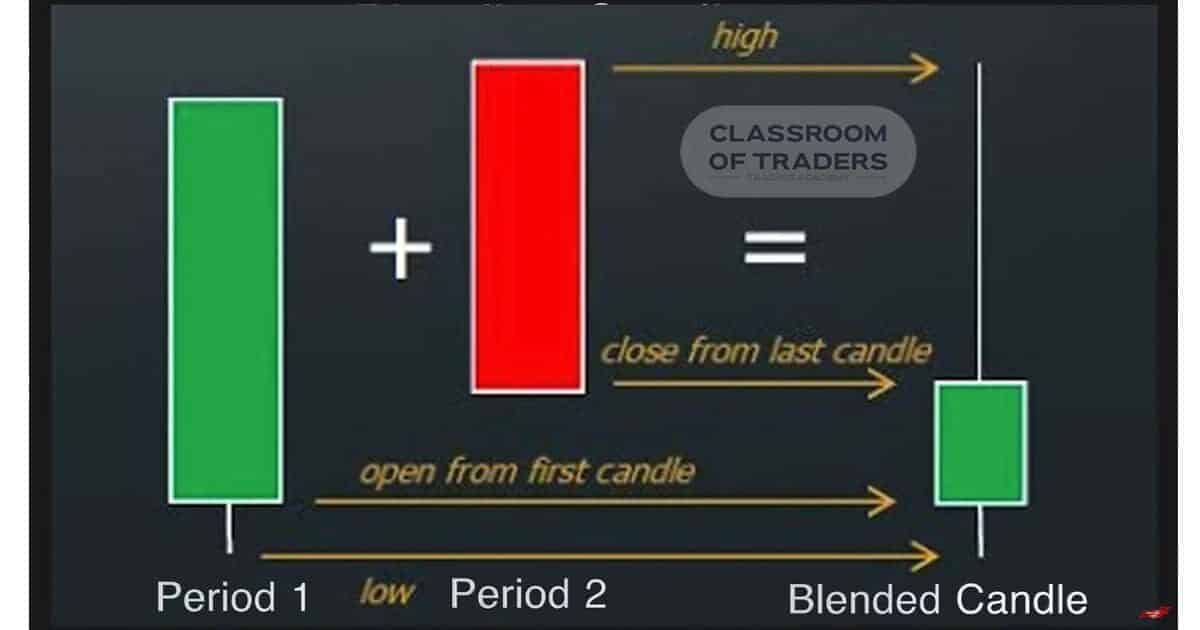
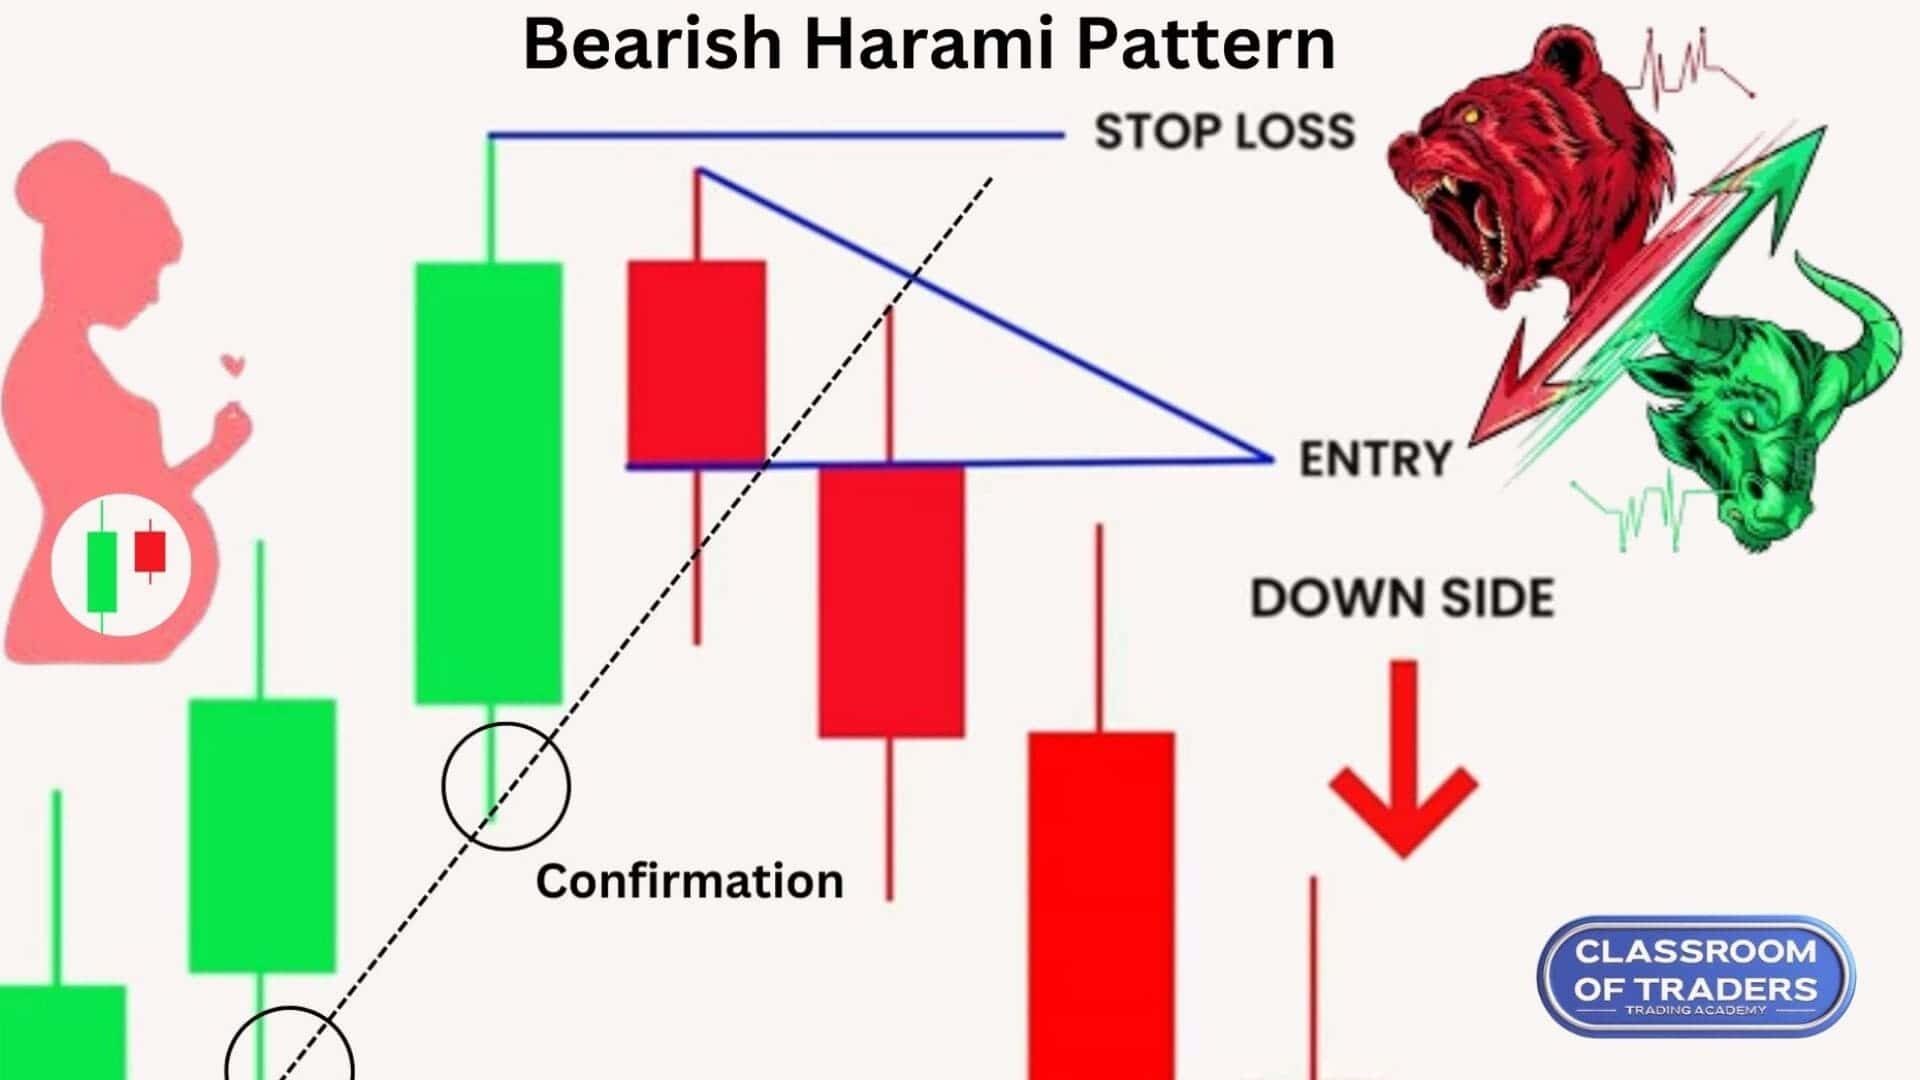
Bearish Harami is a multiple candlestick pattern. It has two candlestick formations. The first candle is a bull candle and second is a bear candle. Now if you see in the above image, the first bull candle covers the second candle body fully. So it forms like a harami candle that shows us the market is going to reverse.

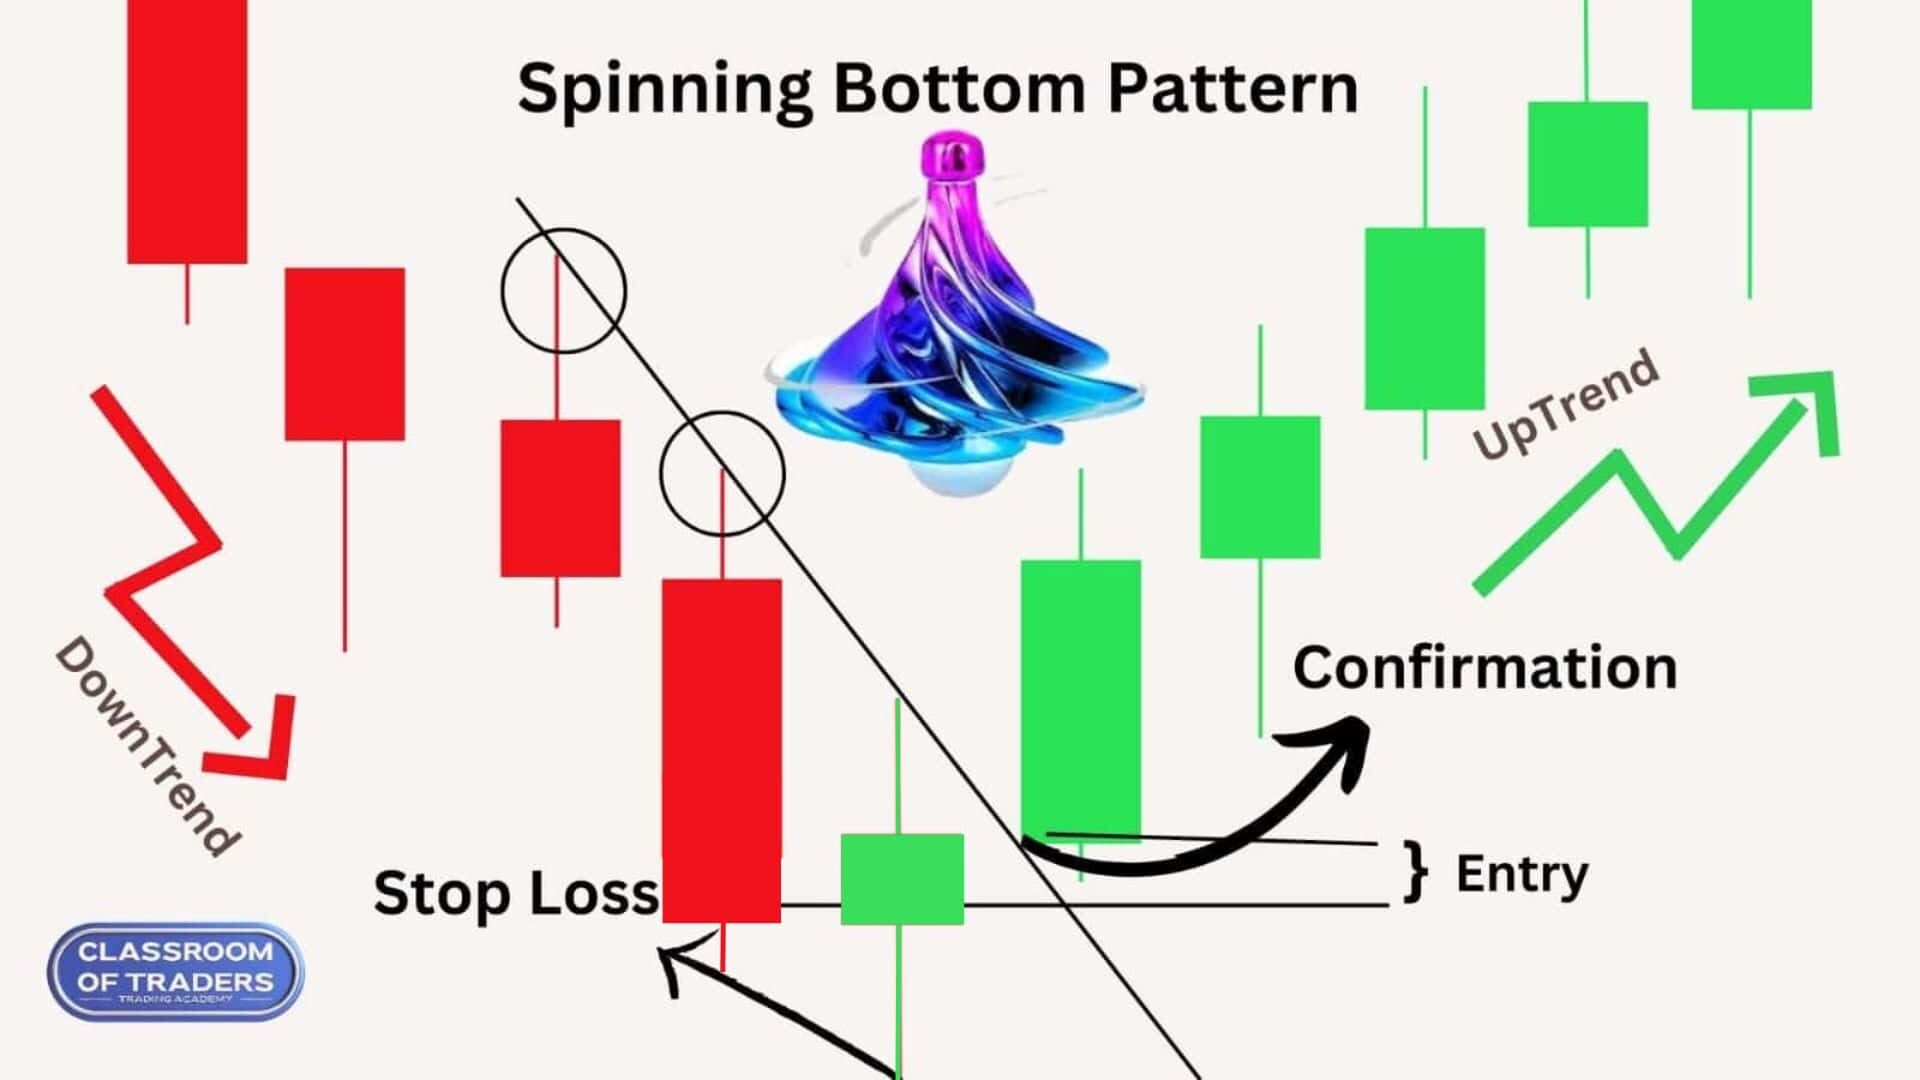
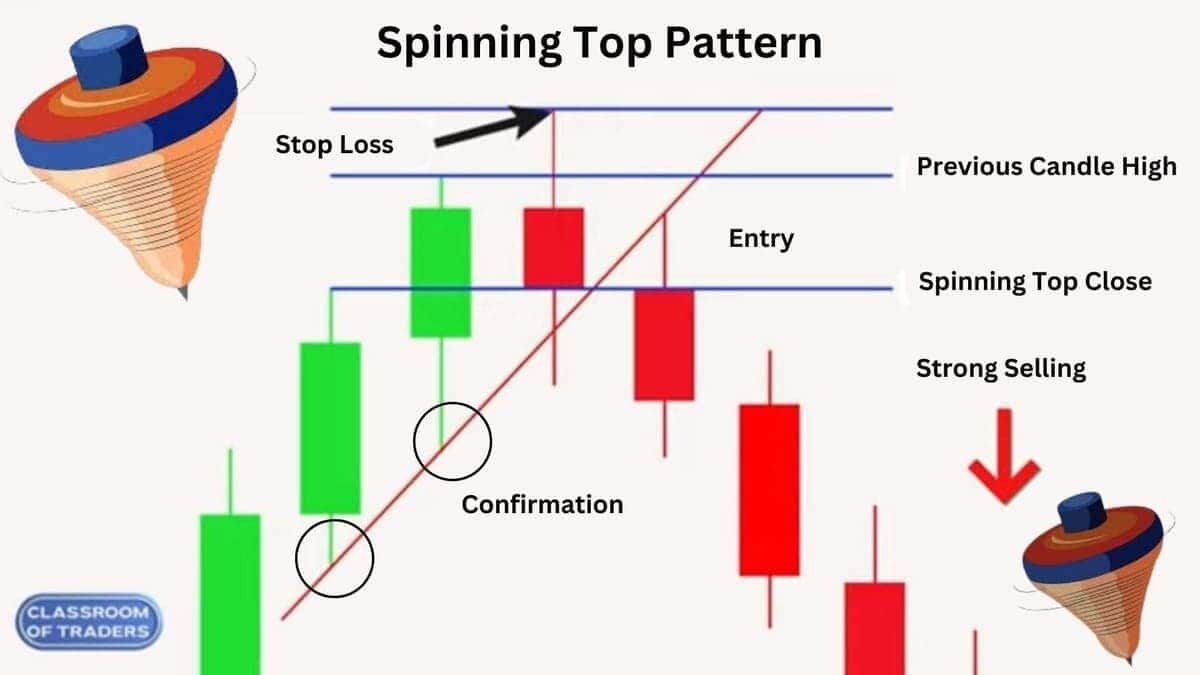
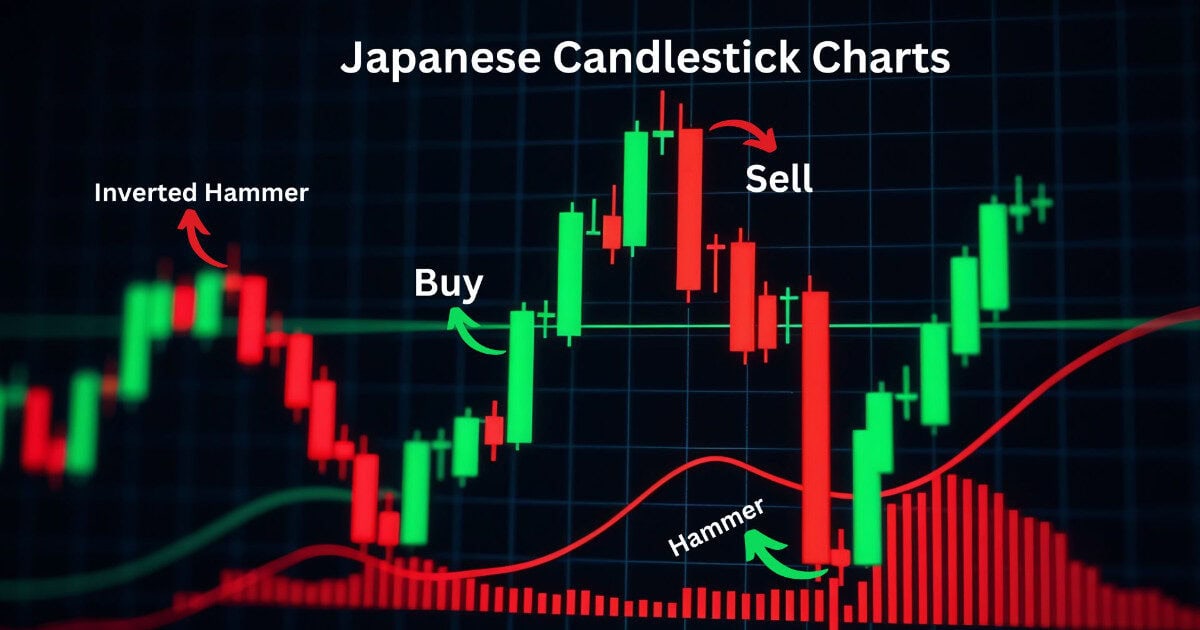
If you see in the above image, there is a Spinning Top formation at the low trend. So as per the single candlestick pattern theory of Spinning Top formation, the market is going to reverse. Then we also got confirmation that there is also a bear harami pattern is formed. Overall we have strong confirmation that the market will definitely move down.
Theory of Bearish Harami Pattern
Now we will be analyzing how the market will perform in this pattern. And how to analyze and take trade with this pattern.

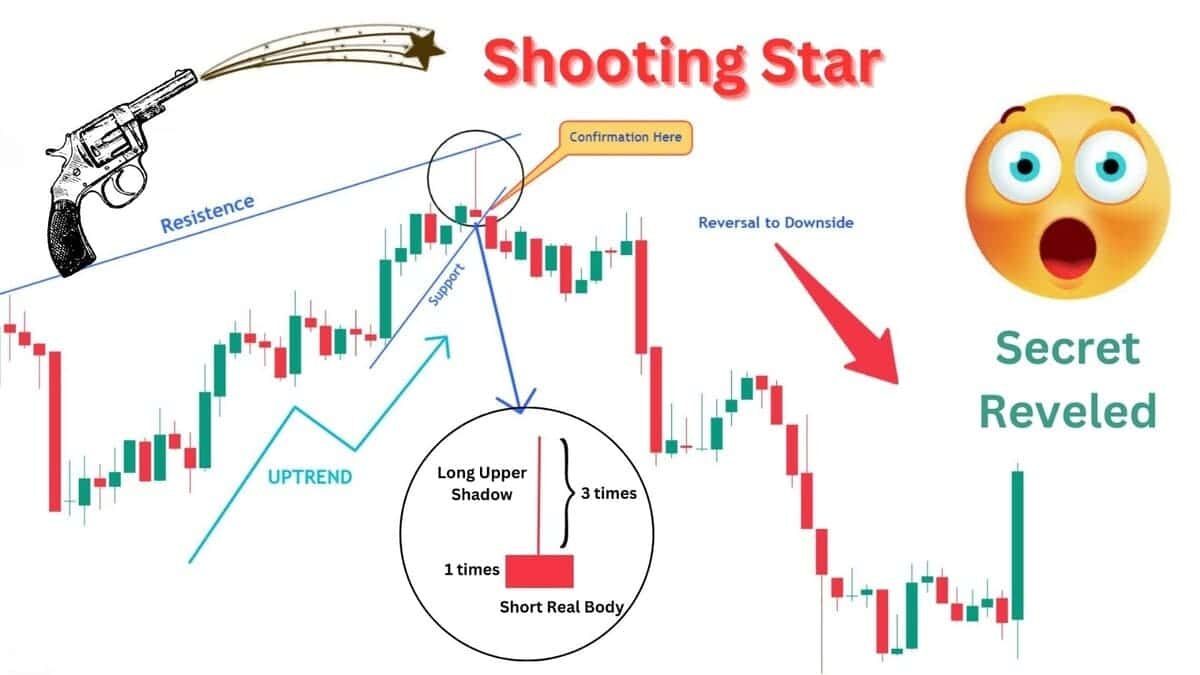
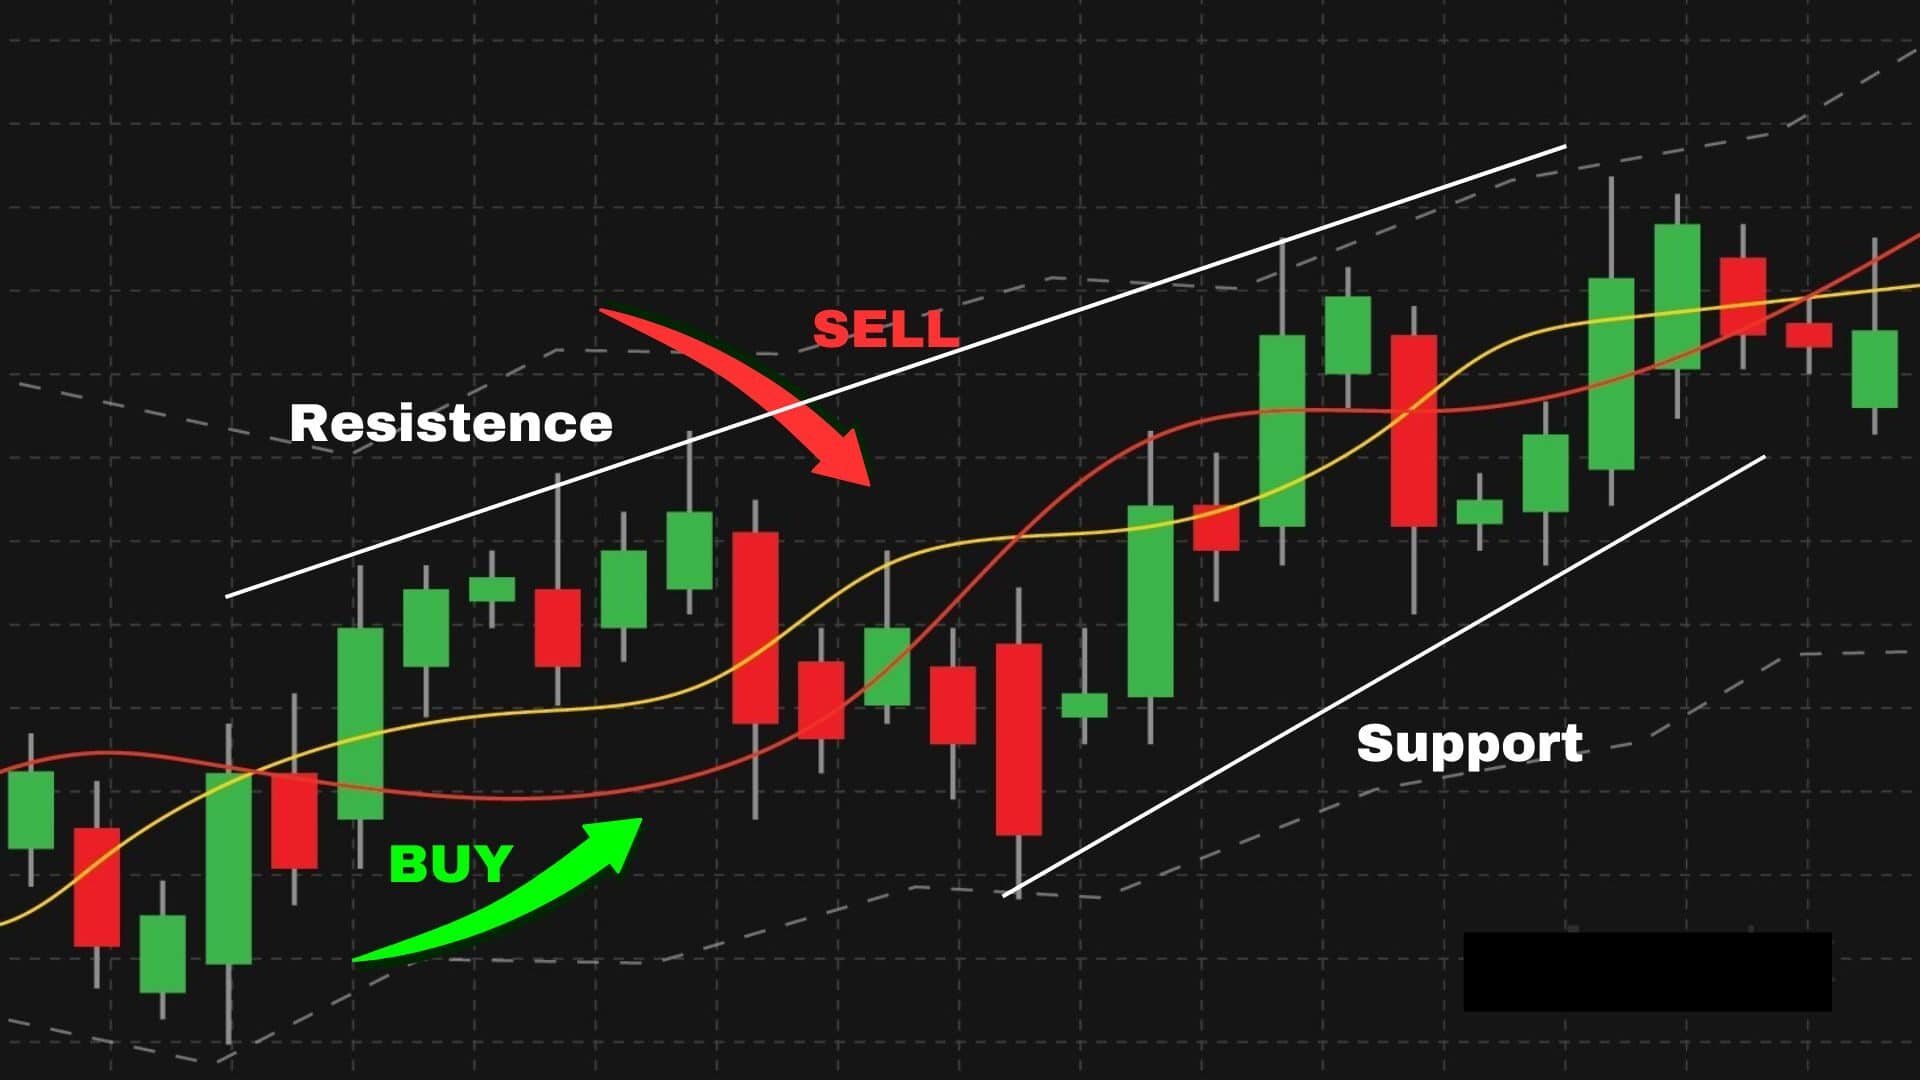
As you see in the above image the Bearish Harami formed in the high trend. Then you can also see that there is a Shooting Star formation. Before these patterns were formed there was an uptrend. You can see that the market has full control over the buyers and reached the high price. Then the seller pushed the market for the reversal at the resistance level. This pattern should be formed in a higher timeframe. Then we can also analyze this pattern in the inner timeframe to check for structure formation. So we can take a Sell Entry in the next running candle.
Confirmation of Bearish Harami Pattern
If the next candle of the Bearish Harami breaks the previous support trend line, we can get confirmation that the market is going to fall. So we can take a sell entry to make a profit.

Entry for Bearish Harami Pattern
The Entry for the Bearish Harami Pattern will be between the running candle open price and the previous candle low price by analyzing in the inner timeframe to take entry in the sell range as shown in 1.

If the pattern is formed as shown in 2, you make an entry by analyzing the inner timeframe and entry at the resistance level.
Note: For taking entry you should always analyze the 15 min or lesser timeframe. You should take an entry on the cheapest price, so you can make a huge profit.
Stop Loss for Bearish Harami Pattern

The Stop Loss for Bearish Harami Pattern will be the low price of the anyone of the Bearish Harami as shown above image.
Steps to check before taking the entry with this pattern.
Step 1: Search for the Bearish Harami pattern in the higher time frame.
Step 2: Check if the pattern is in a high trend and the prior trend should be an uptrend.
Step 3: Check whether the bear harami is formed correctly. And you also check the 2nd candle that shows any single candlestick pattern.
Step 4: Check the structure formation if any in the inner timeframe of the pattern. If you get the perfect structure move on to the next step.
Step 5: Set entry and stop loss level as discussed in theory and execute the trade.
Step 6: Check for confirmation that the previous resistance line is broken, we also got confirmation that it is on a high trend, and the second candle also has a reversal pattern, so the market will surely move down and we can make a huge profit.
Bearish Harami Pattern Video Tutorial in English
How to Identify and Trade Trend Reversals in Stock Markets
Learn how to identify and trade the Bearish Harami Pattern, a powerful trend reversal signal in Japanese candlestick charting. In this tutorial, we’ll cover the formation, structure, and key strategies to profit from this pattern in stock market trading. Whether you’re a beginner or an experienced trader, this english language video will help you understand how to spot Bearish Harami, confirm its validity, and use it to make informed trading decisions. Don’t miss out on mastering this essential candlestick pattern to enhance your trading strategy!
பேரிஷ் ஹராமி பண்பாட்டு வீடியோ பயிற்சி
பங்குச் சந்தைகளில் போக்கு மாற்றங்களை கண்டறிந்து வர்த்தகம் செய்வது எப்படி
இந்த பேரிஷ் ஹராமி பண்பாட்டு வீடியோ பயிற்சியில், ஜப்பானிய கன்டிள்ஸ்டிக் சார்ட் தொழில்நுட்பத்தில் இந்த சக்திவாய்ந்த போக்கு மாற்றச் சிக்னலை எவ்வாறு கண்டறிந்து வர்த்தகம் செய்ய வேண்டும் என்பதை கற்றுக்கொள்ளவும். இந்த வீடியோவில், பேரிஷ் ஹராமி பண்பாட்டு உருவாக்கம், கட்டமைப்பு மற்றும் வர்த்தகத்தில் லாபம் அடைய முக்கியமான நெறிமுறைகள் பற்றிய முழுமையான விளக்கம் வழங்கப்படும். நீங்கள் ஆரம்பிக்கின்றவராக இருந்தாலும், அனுபவமுள்ள வர்த்தகராக இருந்தாலும், இந்த பயிற்சி உங்களுக்கு பேரிஷ் ஹராமி பண்பாட்டைப் புகார்ப்படுத்த, அதனை உறுதிப்படுத்த மற்றும் அறிவார்ந்த வர்த்தக முடிவுகளை எடுக்க உதவும். இந்த அடிப்படை கன்டிள்ஸ்டிக் பண்பாட்டை கற்றுக்கொண்டு உங்கள் வர்த்தகத் திட்டத்தை மேம்படுத்திக் கொள்ளுங்கள்!
Conclusion
In the overall analyze, this pattern shows us the possible reversal of the trend. For more in depth understanding and learning, you can contact classroom of traders to get more knowledge in stock market trading.
To know more, Click here…