Top 5 Best Forex Brokers in 2025
Top 5 Forex Brokers in India, How to Choose the Best Forex Broker, AvaTrade, XM Global Limited, FXTM, Exness, Interactive Brokers


Top 5 Forex Brokers in India, How to Choose the Best Forex Broker, AvaTrade, XM Global Limited, FXTM, Exness, Interactive Brokers
In this blog, we will see about the Bearish Harami Pattern, which is one of the Japanese candlestick charting techniques. We will deeply describe the Bearish Harami Pattern formation, structure, theory, and techniques to analyze and make profit with this pattern.
You will learn more about the Bearish Harami Pattern in detail, which you could use in your trading technique. So read the full blog to get a better understanding of the pattern and techniques. Let’s dive into the concept.

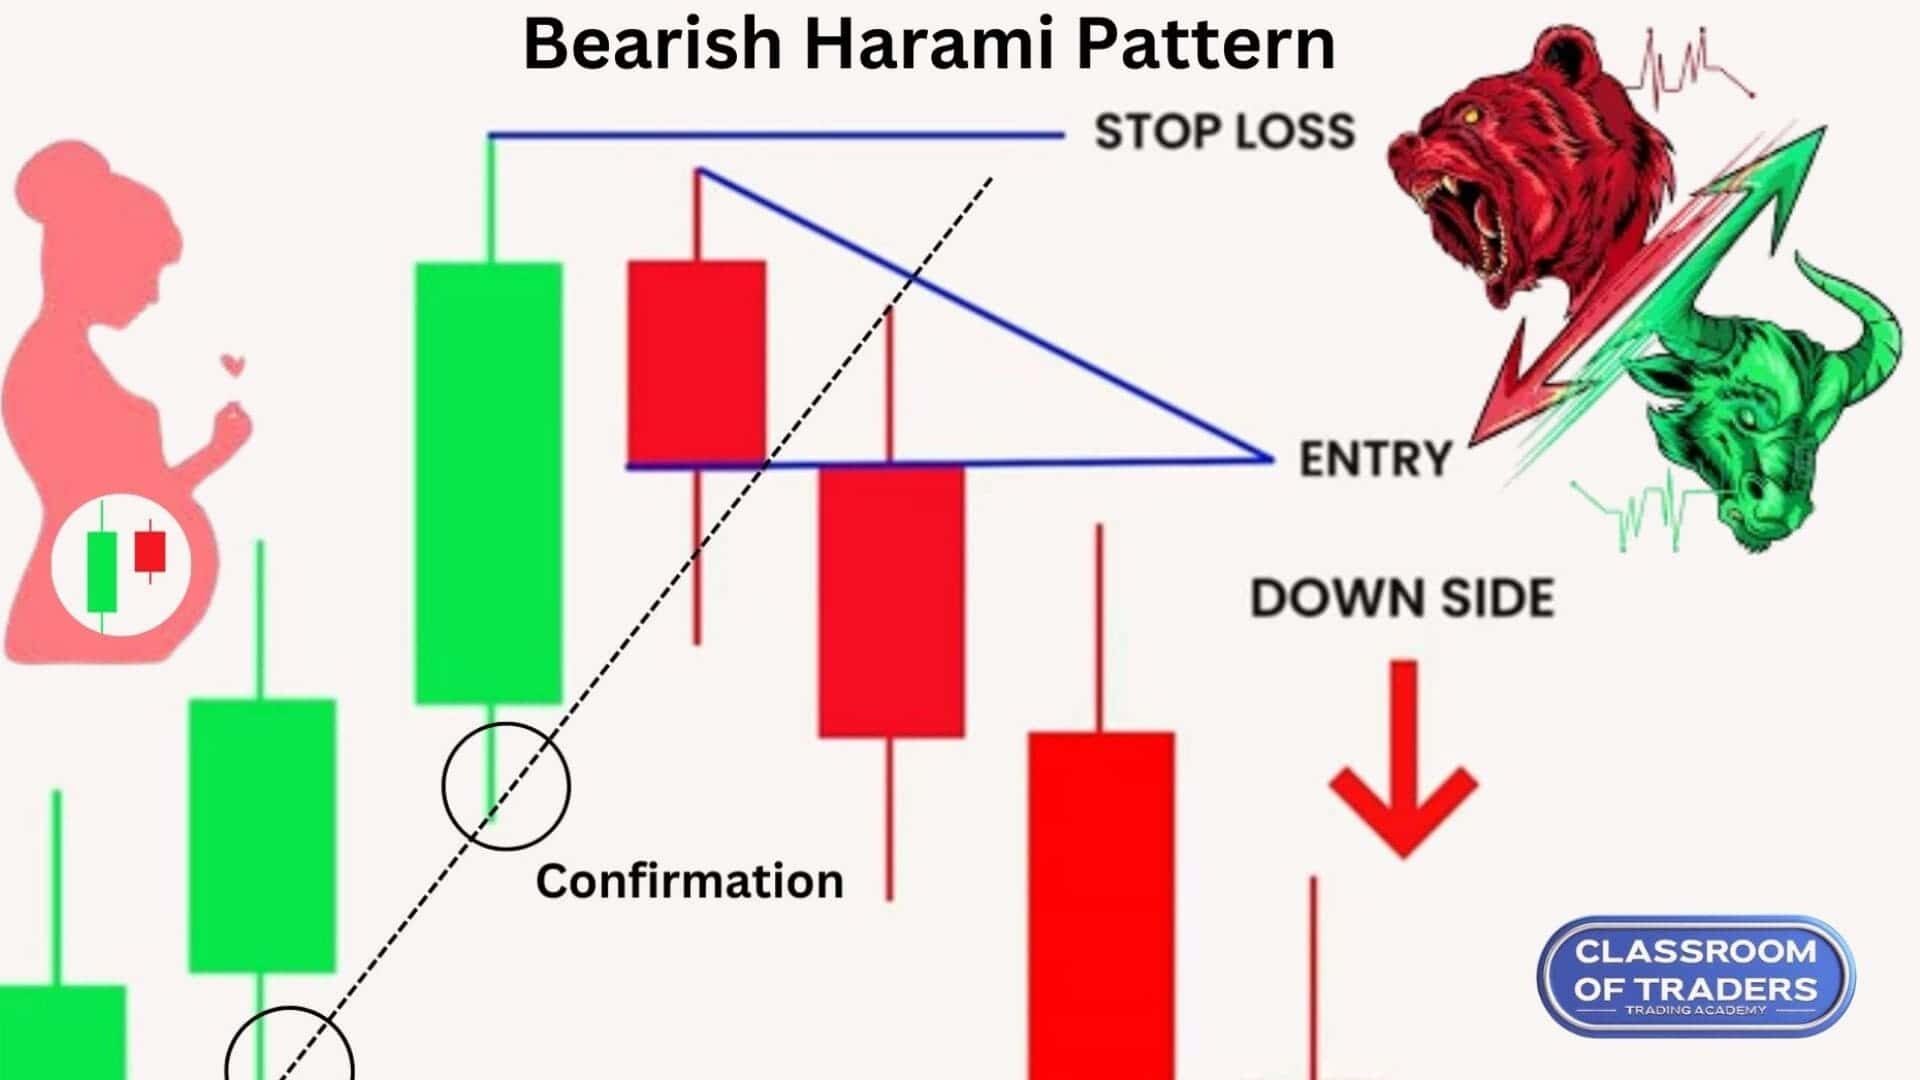
The Bearish Harami Pattern is a trend reversal pattern. It is formed on the Low Trend in the chart. So the prior trend should be a downtrend. If this pattern is formed in the High trend, it has the possibility that this pattern will work 80% in the market.
Bearish Harami is a multiple candlestick pattern. It has two candlestick formations. The first candle is a bull candle and second is a bear candle. Now if you see in the above image, the first bull candle covers the second candle body fully. So it forms like a harami candle that shows us the market is going to reverse.

If you see in the above image, there is a Spinning Top formation at the low trend. So as per the single candlestick pattern theory of Spinning Top formation, the market is going to reverse. Then we also got confirmation that there is also a bear harami pattern is formed. Overall we have strong confirmation that the market will definitely move down.
Now we will be analyzing how the market will perform in this pattern. And how to analyze and take trade with this pattern.

As you see in the above image the Bearish Harami formed in the high trend. Then you can also see that there is a Shooting Star formation. Before these patterns were formed there was an uptrend. You can see that the market has full control over the buyers and reached the high price. Then the seller pushed the market for the reversal at the resistance level. This pattern should be formed in a higher timeframe. Then we can also analyze this pattern in the inner timeframe to check for structure formation. So we can take a Sell Entry in the next running candle.
If the next candle of the Bearish Harami breaks the previous support trend line, we can get confirmation that the market is going to fall. So we can take a sell entry to make a profit.

The Entry for the Bearish Harami Pattern will be between the running candle open price and the previous candle low price by analyzing in the inner timeframe to take entry in the sell range as shown in 1.

If the pattern is formed as shown in 2, you make an entry by analyzing the inner timeframe and entry at the resistance level.
Note: For taking entry you should always analyze the 15 min or lesser timeframe. You should take an entry on the cheapest price, so you can make a huge profit.

The Stop Loss for Bearish Harami Pattern will be the low price of the anyone of the Bearish Harami as shown above image.
Step 1: Search for the Bearish Harami pattern in the higher time frame.
Step 2: Check if the pattern is in a high trend and the prior trend should be an uptrend.
Step 3: Check whether the bear harami is formed correctly. And you also check the 2nd candle that shows any single candlestick pattern.
Step 4: Check the structure formation if any in the inner timeframe of the pattern. If you get the perfect structure move on to the next step.
Step 5: Set entry and stop loss level as discussed in theory and execute the trade.
Step 6: Check for confirmation that the previous resistance line is broken, we also got confirmation that it is on a high trend, and the second candle also has a reversal pattern, so the market will surely move down and we can make a huge profit.
Learn how to identify and trade the Bearish Harami Pattern, a powerful trend reversal signal in Japanese candlestick charting. In this tutorial, we’ll cover the formation, structure, and key strategies to profit from this pattern in stock market trading. Whether you’re a beginner or an experienced trader, this english language video will help you understand how to spot Bearish Harami, confirm its validity, and use it to make informed trading decisions. Don’t miss out on mastering this essential candlestick pattern to enhance your trading strategy!
இந்த பேரிஷ் ஹராமி பண்பாட்டு வீடியோ பயிற்சியில், ஜப்பானிய கன்டிள்ஸ்டிக் சார்ட் தொழில்நுட்பத்தில் இந்த சக்திவாய்ந்த போக்கு மாற்றச் சிக்னலை எவ்வாறு கண்டறிந்து வர்த்தகம் செய்ய வேண்டும் என்பதை கற்றுக்கொள்ளவும். இந்த வீடியோவில், பேரிஷ் ஹராமி பண்பாட்டு உருவாக்கம், கட்டமைப்பு மற்றும் வர்த்தகத்தில் லாபம் அடைய முக்கியமான நெறிமுறைகள் பற்றிய முழுமையான விளக்கம் வழங்கப்படும். நீங்கள் ஆரம்பிக்கின்றவராக இருந்தாலும், அனுபவமுள்ள வர்த்தகராக இருந்தாலும், இந்த பயிற்சி உங்களுக்கு பேரிஷ் ஹராமி பண்பாட்டைப் புகார்ப்படுத்த, அதனை உறுதிப்படுத்த மற்றும் அறிவார்ந்த வர்த்தக முடிவுகளை எடுக்க உதவும். இந்த அடிப்படை கன்டிள்ஸ்டிக் பண்பாட்டை கற்றுக்கொண்டு உங்கள் வர்த்தகத் திட்டத்தை மேம்படுத்திக் கொள்ளுங்கள்!
In the overall analyze, this pattern shows us the possible reversal of the trend. For more in depth understanding and learning, you can contact classroom of traders to get more knowledge in stock market trading.
To know more, Click here…
In this blog, we will see about the Bullish Harami Pattern, which is one of the Japanese candlestick charting techniques. We will deeply describe the Bullish Harami Pattern formation, structure, theory, and techniques to analyze and make profit with this pattern.
You will learn more about the Bullish Harami Pattern in detail, which you could use in your trading technique. So read the full blog to get a better understanding of the pattern and techniques. Let’s dive into the concept.

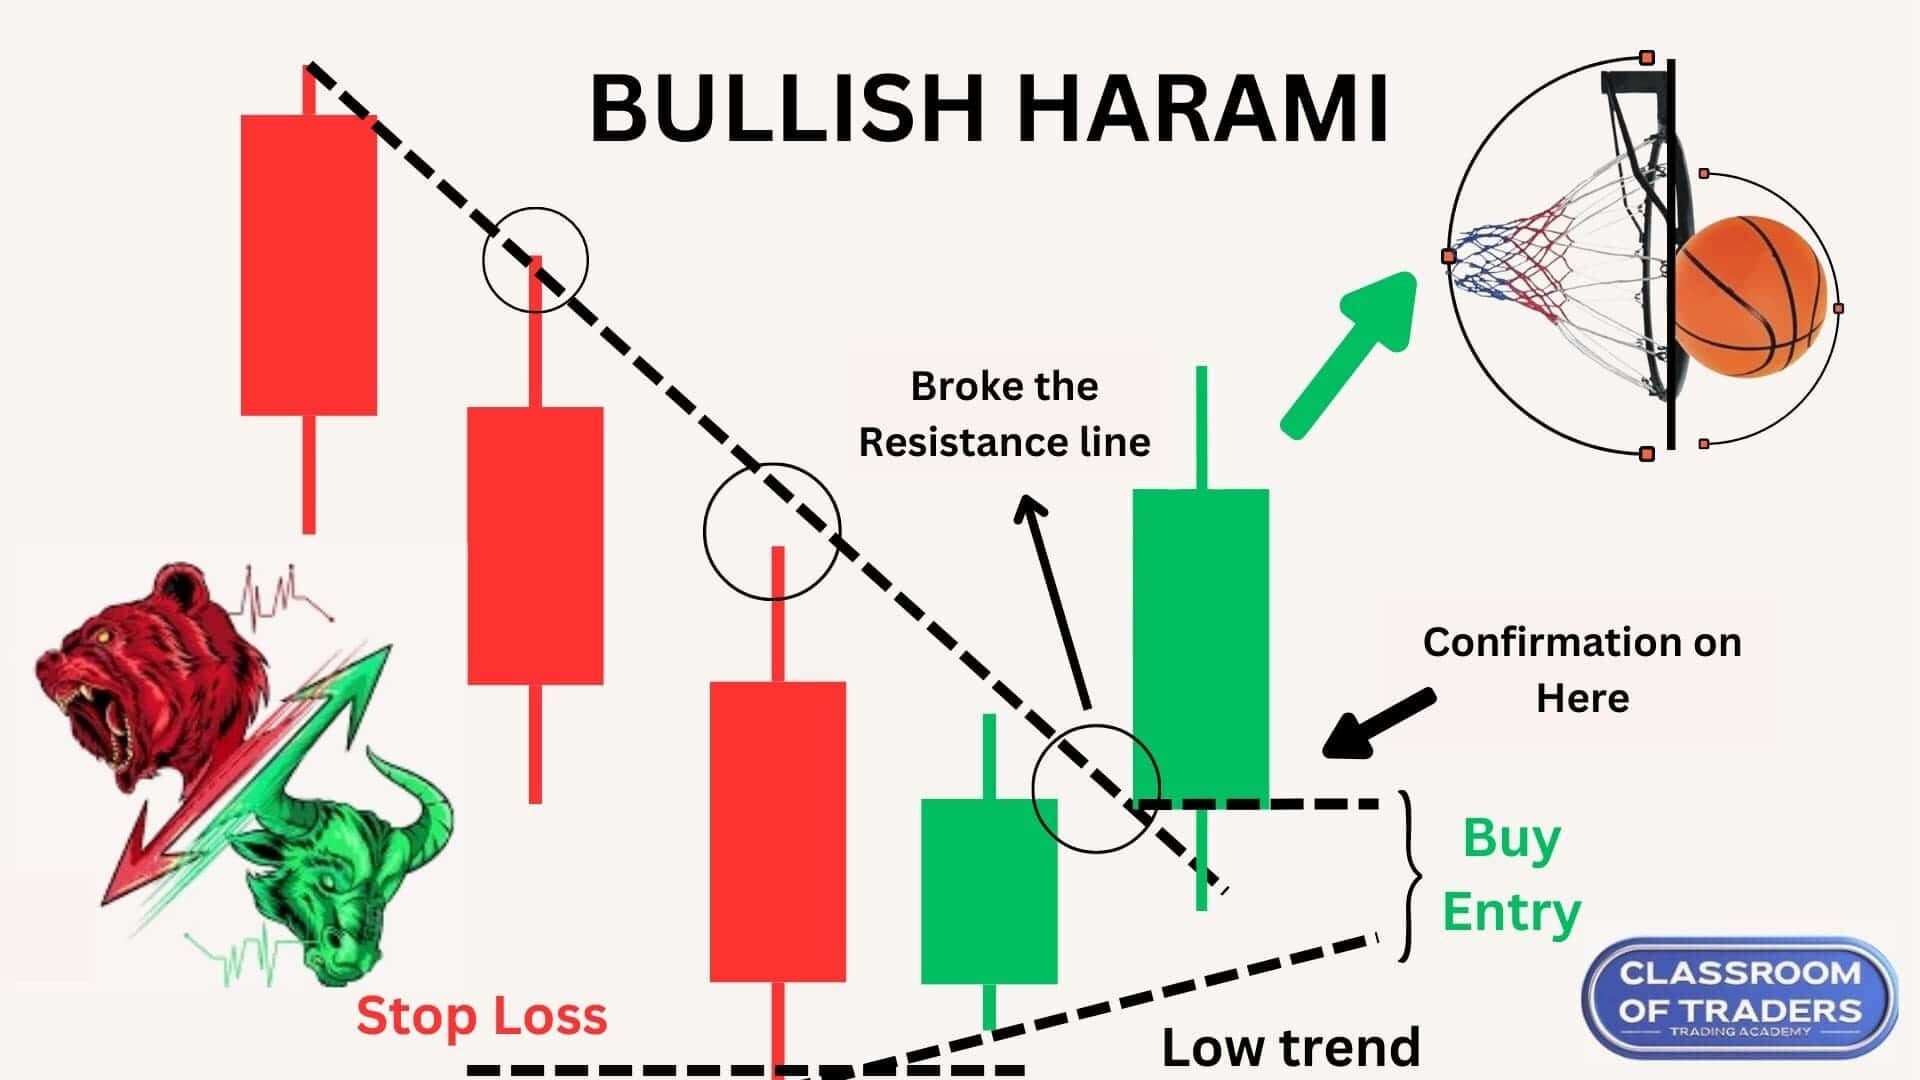
The Bullish Harami Pattern is a trend reversal pattern. It is formed on the Low Trend in the chart. So the prior trend should be a downtrend. If this pattern is formed in the low trend, it has the possibility that this pattern will work 80% in the market.
Bullish Harami is a multiple candlestick pattern. It has two candlestick formations. The first candle is a bear candle and second is a bull candle. Now if you see in above image, the first bear candle covers the second candle body fully. So it forms like a harami candle that shows us the market is going to reverse.

If you see in the above image, there is a Hammer Pattern formation at the low trend. So as per the single candlestick pattern theory of hammer formation, the market is going to reverse. Then we also got confirmation that there is also a bull harami pattern is formed. Overall we have strong confirmation that the market will definitely move up.
Now we will be analyzing how the market will perform in this pattern. And how to analyze and take trade with this pattern.

As you see in the above image the Bullish Harami formed in the low trend. Then you can also see that there is a Spinning Bottom formation. Before these patterns were formed there was a downtrend. You can see that the market has full control over the seller and reached the low price. Then the buyer pushed the market for the reversal at the support level. This pattern should be formed in a higher timeframe. Then we can also analyze this pattern in the inner timeframe to check for structure formation. So we can take a Buy Entry in the next running candle.
If the next candle of the Bullish Harami breaks the previous resistance trend line, we can get confirmation that the market is going to rise. So we can take a buy entry to make a profit.

The Entry for the Bullish Harami Pattern will be between the running candle open price and the previous candle low price by analyzing in the inner timeframe to take entry in the buy range as shown in 1.

If the pattern is formed as shown in 2, you make an entry by analyzing the inner timeframe and entry at the support level.
Note: For taking entry you should always analyze the 15 min or lesser timeframe. It shows how much cheaper you can buy or sell the script according to your analysis.

The Stop Loss for Bullish Harami Pattern will be the low price of the anyone of the Bullish Harami as shown above image.

You can also make a Trailing Stop Loss as the market goes above by drawing a support line as shown in the above image.
Step 1: Search for the Bullish Harami pattern in the higher time frame.
Step 2: Check if the pattern is in a low trend and the prior trend should be a downtrend.
Step 3: Check whether the Bull Harami is formed correctly. And you also check the 2nd candle that shows any single candlestick pattern.
Step 4: Check the structure formation if any in the inner timeframe of the pattern. If you get the perfect structure move on to the next step.
Step 5: Set entry and stop loss level as discussed in theory and execute the trade.
Step 6: Check for confirmation that the previous resistance line is broken, we also got confirmation that this pattern is on a low trend, and the second candle also has a reversal pattern, so the market will surely move up and we can make a huge profit.
In this blog, we are going to see about the Spinning Bottom Pattern, which is one of the Japanese candlestick charting techniques. We will deeply describe the Spinning Bottom Pattern formation, structure, theory, and techniques to analyze and make profit with this pattern.
You will learn more about the Spinning Bottom Pattern in detail, which you could use in your trading technique. So read the full blog to get a better understanding of the pattern and techniques. Let’s dive into the concept.

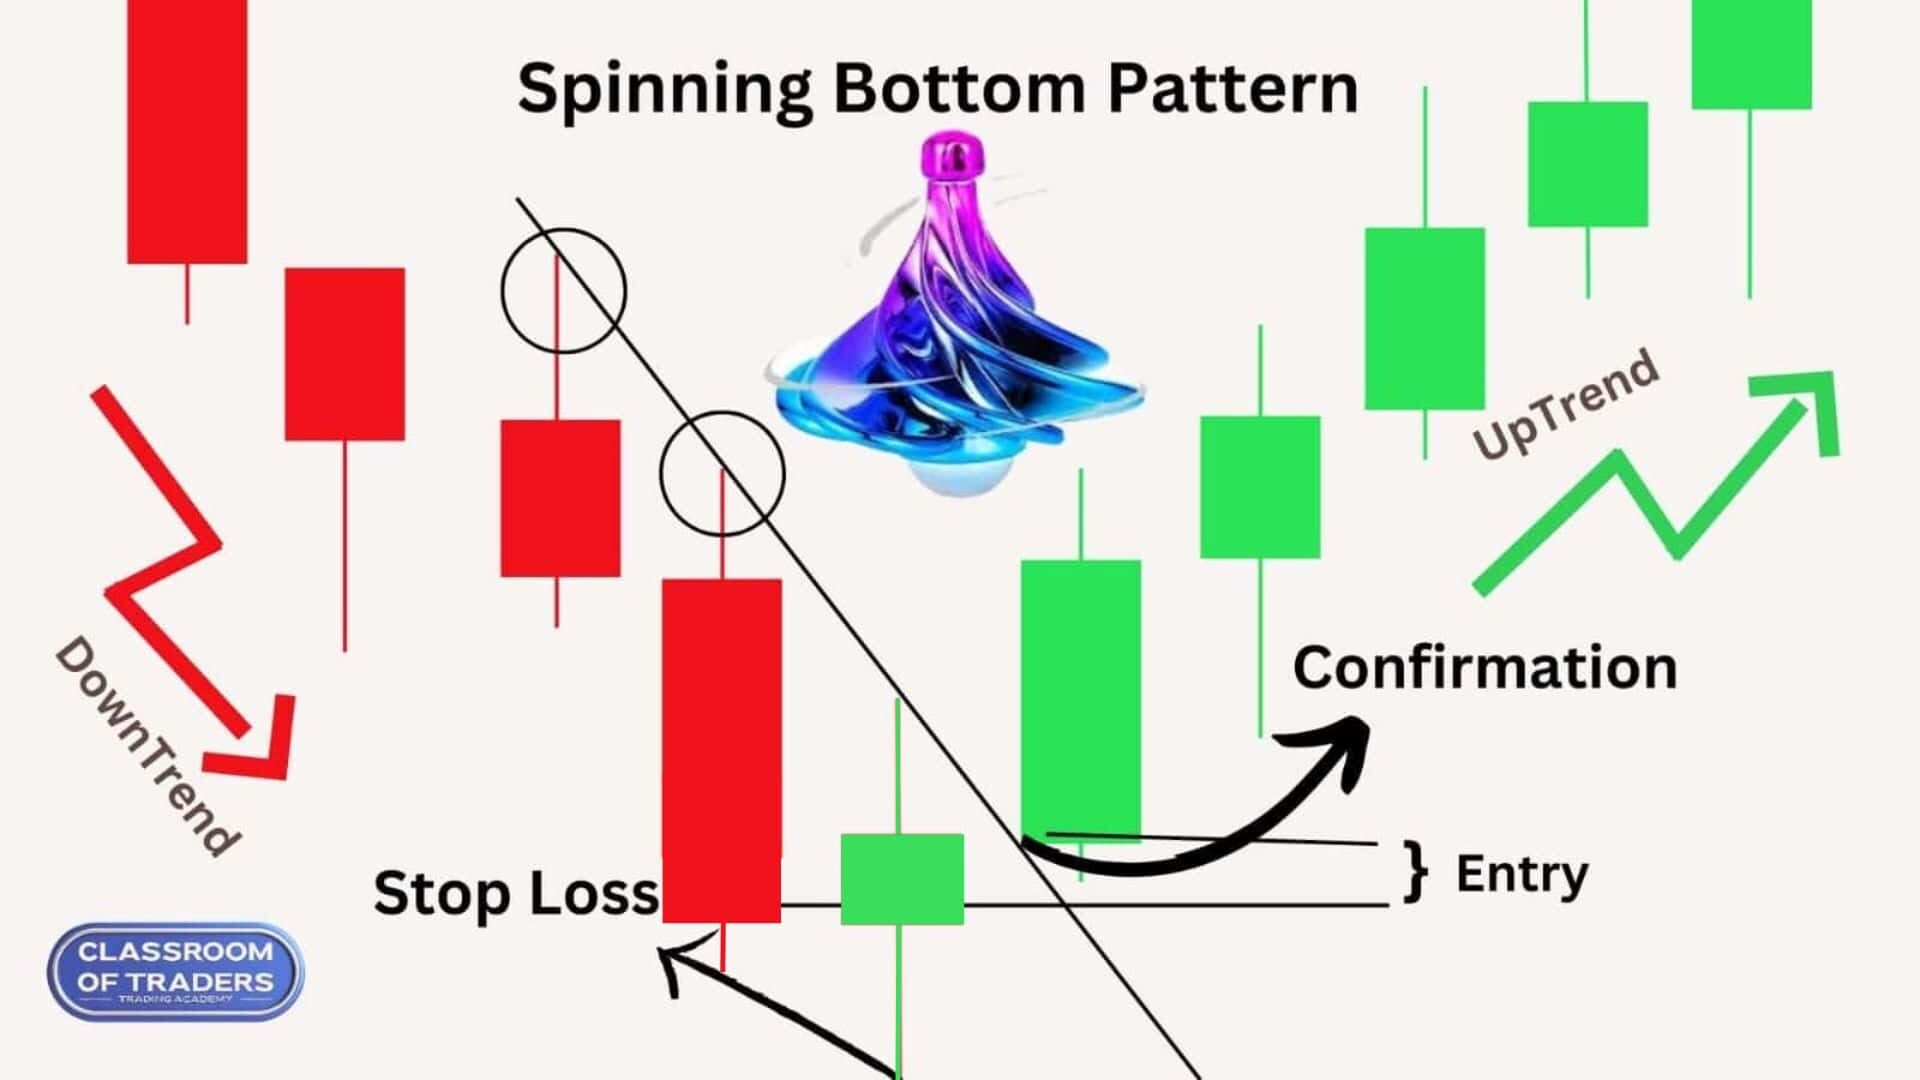
The Spinning Bottom Pattern is a trend reversal pattern. It is formed on the Low Trend in the chart. So the prior trend should be an downtrend. If this pattern is formed in the low trend, it has the possibility that this pattern will work 70% in the market.

The Spinning Bottom has a small real body and a long upper and lower shadow. The upper and lower shadow must be 1.5 times longer than the Spinning Bottom body. That is, if the body is 1 time the size means the upper and lower shadow must be 1.5 times longer or more than the size of the body. For the bearish candle, the open price will be lesser than the close price.
Now let’s see how the Spinning Bottom Pattern structure should be formed.
This structure tells about the presence of buyers and sellers in the pattern. On the open price, the buyer pushed the price high price and then the sellers took control of the market and pushed to the low price, and again the buyers came in pushed a little up and closed above the open price. This structure forms like a Spinning Bottom in the higher timeframe.
So if this structure is formed inside the Spinning Bottom in the inner timeframe, the pattern has a strong possibility that it will work 80% and will give a buy signal as the market moves up. We have to check this structure in the inner timeframe of the Spinning Bottom.

This Structure shows more buying strength and the pattern forms at the low trend. So the market will definitely move upside. Then if you draw a trend line in the inner timeframe, you can analyze that the structure of this pattern will hit the resistance and support of the trend. At that support at a low price there will be a reversal pattern at the inner timeframe that pushes the market upside. Overall the analysis shows that the market will definitely move upside.
This structure forms like on the open price, the sellers pushed the price to the low price and then the buyers pushed to the high price, and again the sellers came in pushed a little down and closed above the open price. This structure forms like a Spinning Bottom in the higher timeframe. So this structure gives less possibility that it will work in the market.

Note: We have to analyze the Spinning Bottom pattern in the higher timeframe. So you can check this pattern structure in the inner timeframe analysis. Spinning Bottom pattern will be formed in all the time frames. It is necessary to check the pattern in a higher timeframe to analyze more and it gives more accuracy to trade.
Now we will be analyzing how the market will perform in this pattern. And how to analyze and take trade with this pattern.

As you see in the above image the Spinning Bottom formed in the low trend. Before the pattern formed there was a downtrend. You can see that the market has full control over the seller and reached the low price. Then the seller came in and pushed the price down and again buyer pushed the price up and closed above the open price, thus forms like a Spinning Bottom. This pattern should be formed in a higher timeframe.
Then we can analyze this pattern in the inner timeframe to check for structure formation. If the structure is formed as we discussed above, we have a high possibility that this pattern will work in the market. So we can take a Buy Entry in the next running candle.
If the next candle of the Spinning Bottom breaks the previous resistance trend line, we can get confirmation that the market is going to rise. So we can take a buy entry to make a profit.

The Entry for the Spinning Bottom Pattern will be between the running candle open price and the previous candle low price. You can analyze in the inner timeframe to take entry in the buy range as shown below the image.

The Stop Loss for Spinning Bottom Pattern will be the low price of the Spinning Bottom as shown below image.

You can also make a Trailing Stop Loss as the market goes above by drawing a support line as shown in the above image.
Step 1: Search for the Spinning Bottom pattern in the higher time frame.
Step 2: Check if the pattern is in a low trend and the prior trend should be a downtrend.
Step 3: Check the Spinning Bottom structure –> it should be bearish –> the upper and lower shadow should be 1.5 times greater than the size of the body with perfect structure formation.
Step 4: Check the structure formation in the inner timeframe of the pattern. If you get the perfect structure move on to the next step.
Step 5: Set entry and stop loss level as discussed in theory and execute the trade.
Step 6: Check for confirmation that the previous resistance line is broken, we also got confirmation that it is on a low trend, and the structure formation of the Spinning Bottom is perfect so the market will surely move down and we can make a huge profit.
Learn how to identify and trade the Spinning Bottom Candlestick Pattern in this comprehensive video tutorial in English. Understand the structure, theory, and significance of this pattern in technical analysis. Discover how Spinning Bottoms signal market indecision and potential trend reversals, and how you can use them to enhance your trading strategy. Watch now to unlock the secrets of profitable trading with Spinning Bottom candlesticks!
Learn how to identify and trade the Spinning Bottom Candlestick Pattern in this comprehensive video tutorial in Tamil. Understand the structure, theory, and significance of this pattern in technical analysis. Discover how Spinning Bottoms signal market indecision and potential trend reversals, and how you can use them to enhance your trading strategy. Watch now to unlock the secrets of profitable trading with Spinning Bottom candlesticks!
In this blog, we explore the Spinning Bottom Pattern, a trend reversal pattern commonly used in Japanese candlestick charting. The Spinning Bottom pattern indicates market indecision and is typically formed during a downtrend. The pattern has a small real body with long upper and lower shadows, signaling a shift in market sentiment.
We discuss the structure of the Spinning Bottom Pattern, including the OHLC and OLHC structures, both of which suggest varying strengths of buyer and seller activity. The OHLC structure is particularly strong and signals a higher probability of an upward price movement, whereas the OLHC structure indicates a weaker possibility of success.
In this guide, we also dive into the theory behind the Spinning Bottom Pattern, how to confirm its formation, and the ideal entry and stop-loss strategies for profitable trading. A proper understanding of the pattern in a higher timeframe, followed by confirmation in an inner timeframe, can significantly improve trade accuracy.
The blog also covers steps to ensure a successful trade with the Spinning Bottom Pattern, emphasizing the importance of setting proper entry points, stop-loss levels, and confirming the breakout of resistance before executing a trade.
Additionally, the blog provides video tutorials in both English and Tamil, making it easier for traders from different regions to understand and apply the pattern in their trading strategies.
For more detailed information, including step-by-step analysis and a visual guide, you can refer to the full blog post and watch the tutorials linked below.
By following the guidelines and techniques presented in this blog, you can enhance your trading strategy and increase your chances of profitable trades using the Spinning Bottom pattern.
In this blog, we are going to see about the Shooting Star Pattern, which is one of the Japanese candlestick charting techniques. We will deeply describe the Shooting Star Pattern formation, structure, theory, and techniques to analyze the pattern.
You will learn more about the Shooting Star Pattern in detail, which you could use in your trading technique. So read the full blog to get a better understanding of the pattern and techniques. Let’s dive into the concept.

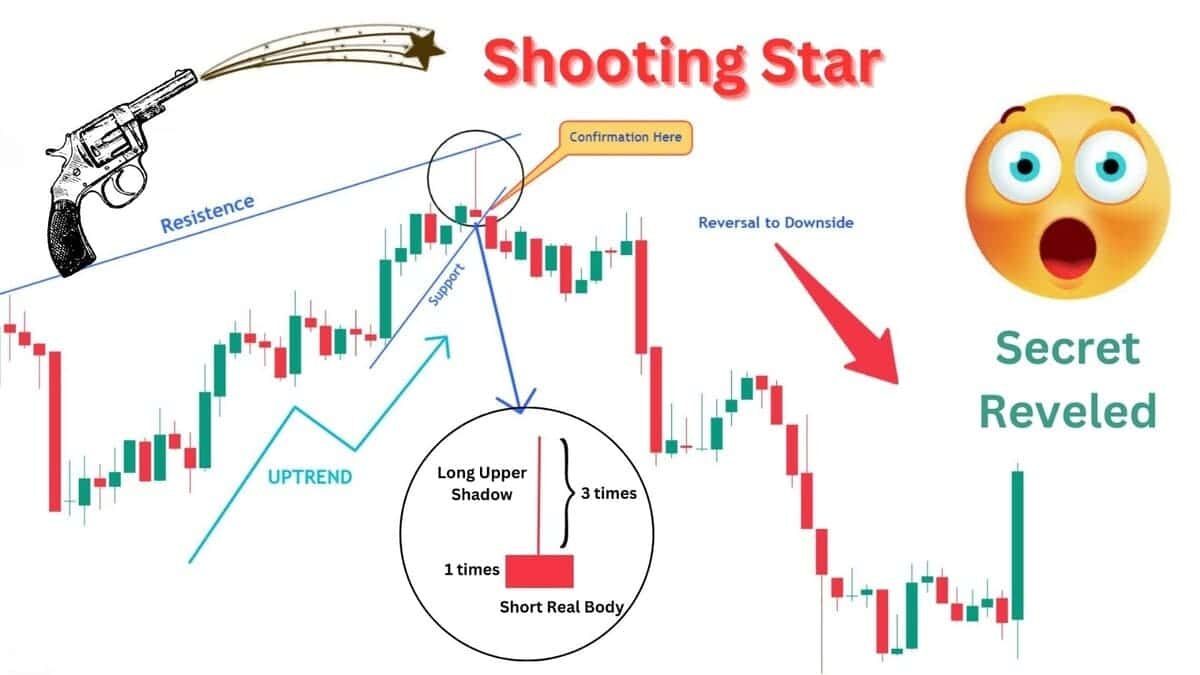
The Shooting Star Pattern is a trend reversal pattern. It is formed on the High Trend in the chart. So the prior trend should be an uptrend. If this pattern is formed in the high trend, it has the possibility that this pattern will work 70% in the market.

It has a small real body and a long upper shadow. The body of the Shooting Star should be 3 times shorter than the upper shadow or the upper shadow must be 3 times longer than the Shooting Star body. That is, if the body is 1 time the size means the upper shadow must be 3 times longer than the size of the body. For the bearish candle, the open price will be greater than the close price.

Note: If the candle of this pattern is in a bullish candle, in some cases it is not considered as a Shooting Star pattern. The reason for this will be explained in detail in the upcoming topic.
Now let’s see how the Shooting Star Pattern structure should be formed. We have different scenarios in which Shooting Star can be formed.

The above image shows the different scenarios in which Shooting Star can be formed. We will see in detail about these patterns in the upcoming topics.

These 2 bullish candles are not Shooting Star because there is buying pressure even though the seller pushed the market down. So this bullish shooting star has less probability that it will work in the market.

This bearish candle is not a Shooting Star pattern because the presence of the seller is low. It has the possibility that the buyer can push the market up fighting with the seller as the volume of the seller is low. As you can see, the upper shadow is only 2 times greater than the real body. The upper shadow should be more than the 3 times of the real body.

This bullish candle is considered a Shooting Star pattern, because as it has a bullish presence it also has a long upper shadow indicating that the seller pushed the market downside. So the market has a high probability that it will further move to the downside.

Now these two bearish Shooting Star patterns are correct. The left side shooting star is the perfect shooting star. It forms bearish with a long upper shadow which is 3 times greater than the size of the body. It means the sellers had pushed the market downward and it will further move down due to the selling pressure.
The right side bearish candle is also a shooting star, but it is not recommended to trade with this shooting star. Because due to the very long upper shadow and the bearish body, the market already reached more selling pressure. So it has only below 50% possibility that this bearish shooting star will work in the market.
You can also check the candle formation in the inner timeframe to get strong confirmation as given in the below image.

If the OLHC structure is formed, it has a high probability that the pattern will work in the market. Because the formation has more selling pressure, so the market has more possibility to move downwards.
If the OHLC structure is formed, it has only 50% probability that the pattern will work in the market. Because the formation is indicating buying pressure at the close of the market.
Note: We have to analyze the Shooting Star pattern in the higher timeframe. So you can check this pattern structure in the inner timeframe analysis. Shooting Star pattern will be formed in all the time frames. It is necessary to check the pattern in a higher timeframe to analyze more and it gives more accuracy to trade.
Now we will be analyzing how the market will perform in this pattern. And how to analyze and take trade with this pattern.

As you see in the above image the Shooting Star formed in the high trend. Before the pattern formed there was an uptrend. You can see that the market has full control over the buyer and reached the high price. Then the seller came in and pushed the price down, thus forms like a shooting star. This pattern should be formed in a higher timeframe. Then we can analyze this pattern in the inner timeframe to check for structure formation. If the structure are formed as we discussed above, we have a high possibility that this pattern will work in the market. So we can take a Sell Entry in the next running candle.
If the next candle of the Shooting Star breaks the previous support trend line, we can get confirmation that the market is going to fall. So we can short the market to make a profit.

The Entry for the Shooting Star Pattern will be between the running candle open price and the previous candle high price. You can analyze in the inner timeframe to take entry in the sell range as shown below the image.

Then as shown above you can take sell entry, as the market will move downside according to our analysis
The Stop Loss for Shooting Star Pattern will be the high price of the Shooting Star

You can also make a Trailing Stop Loss as the market goes below by drawing a resistance line as shown in the above image.
Step 1: Search for the Shooting Star pattern in the higher time frame.
Step 2: Check if the pattern is in a high trend and the prior trend should be an uptrend.
Step 3: Check the Shooting Star structure –> it should be bearish –> the Upper shadow should be 3 times greater than the size of the body with perfect structure formation.
Step 4: Check the structure formation in the inner timeframe of the pattern. If you get the perfect structure move on to the next step.
Step 5: Set entry and stop loss level and execute the trade.
Step 6: Check for confirmation that the previous support line is broken, we also got confirmation that it is on a high trend, and the structure formation of the Shooting Star is perfect so the market will surely move down and we can make a huge profit.
To get detailed information about the Shooting Star Pattern, Click and watch the video 👇
In this comprehensive video tutorial, learn how to identify and trade the Shooting Star Candlestick Pattern effectively. We’ll dive deep into its structure, theory, and significance in technical analysis, explaining how this pattern signals market indecision and potential trend reversals. Whether you’re a beginner or an experienced trader, this tutorial will help you incorporate the Shooting Star Pattern into your trading strategy to enhance your market predictions and make informed decisions. Watch now to understand how to spot this powerful pattern and use it to boost your trading success!
இந்த முழுமையான வீடியோ教程இல், Shooting Star Candlestick Pattern ஐ எவ்வாறு கண்டறிந்து, அதை சரியாக வர்த்தகம் செய்யலாம் என்பதை நீங்கள் கற்றுக்கொள்ளப் போகின்றீர்கள். இந்த வரைபடம் எப்படி சந்தையின் மாற்றங்களை மற்றும் பின்விளைவுகளை குறிக்கின்றது என்பதை விளக்குகிறோம். இது நீங்கள் உங்கள் வர்த்தகத்தை மேம்படுத்த பயன்படுத்தக்கூடிய சக்திவாய்ந்த ஒரு முன்மாதிரியாக இருக்கும். இந்த வீடியோவை தற்போது பாருங்கள், இந்த உத்தரவாதமான முறையை கற்றுக்கொண்டு உங்கள் வர்த்தக வெற்றியை உயர்த்துங்கள்!
Finally for the shooting star pattern the target will be open. You can set according to your risk to reward ratio. The shooting star pattern will best work in the market with above explanation and trading methodology. So learn and practice more in the market to make profit with this pattern. If you want to learn with us, you can reach Classroom Of Traders.
In this blog, we are going to see about the Hanging Man Pattern, which is one of the Japanese candlestick charting techniques. We will deeply describe the Hanging Man Pattern formation, structure, theory, and techniques to analyze the pattern.
You will learn more about the Hanging Man Pattern in detail, which you could use in your trading technique. So read the full blog to get a better understanding of the pattern and techniques. Let’s dive into the concept.

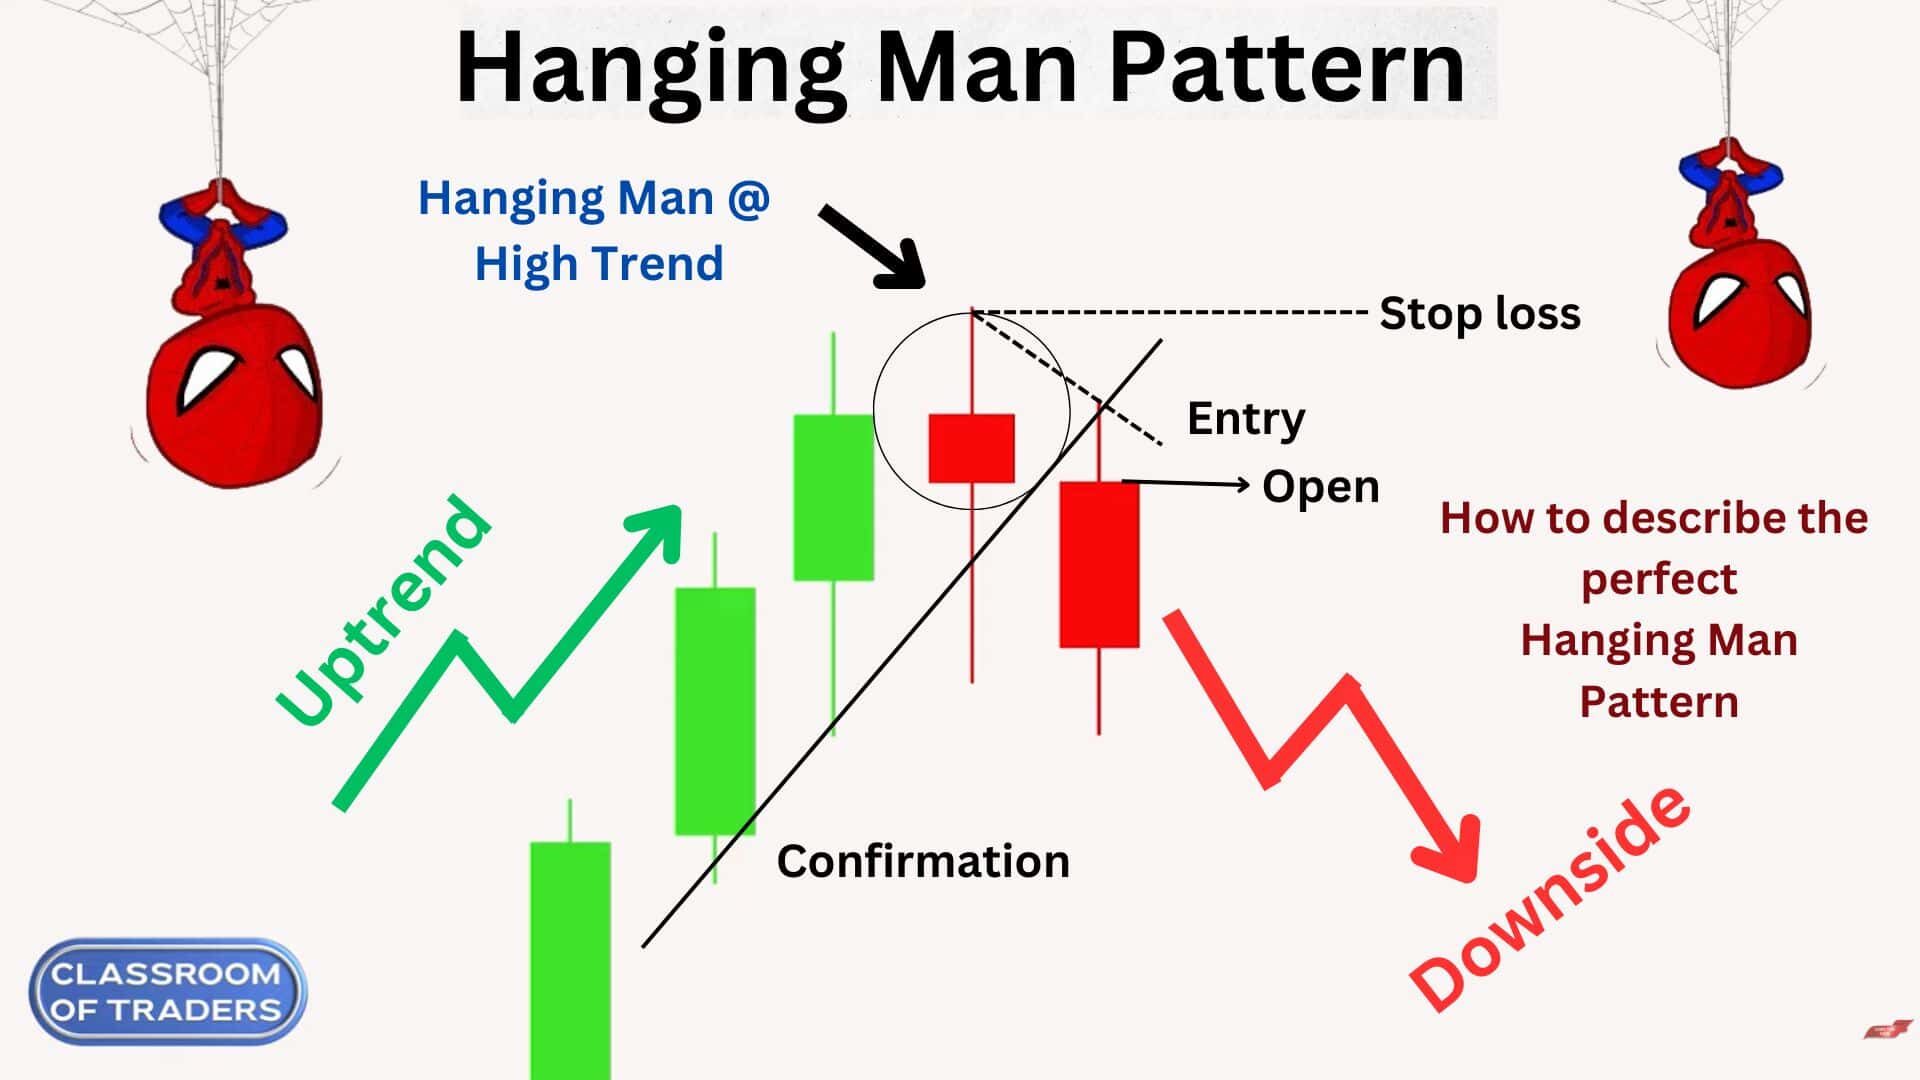
The Hanging Man Pattern is a trend reversal pattern. It is formed on the High Trend in the chart. So the prior trend should be an uptrend. If this pattern is formed in the high trend, it has the possibility that this pattern will work 70% in the market.

Hanging Man has a small real body and a long lower shadow. The body of the hanging man should be 3 times shorter than the lower shadow or the lower shadow must be 3 times longer than the hanging man body. That is, if the body is 1 time the size means the lower shadow must be 3 times longer than the size of the body. For the bearish candle, the open price will be greater than the close price.

Note: If the candle of this pattern is in a bullish candle, it is not considered as a hanging man pattern. The reason for this will be explained in detail in the upcoming topic.
Now we will see how the Hanging Man Pattern structure should be formed.
This structure tells about the presence of buyers and sellers in the pattern. On the open price, the sellers pushed the price down to the low price and then the buyers took control of the market and pushed to the high price, and again the seller came in pushed a little down and closed below the open price. This structure forms like a hanging man in the higher timeframe. So if this structure is formed inside the hanging man, the pattern has a strong possibility that it will work 80% and will give a sell signal as the market will move downside. We have to check this structure in the inner timeframe of the hanging man.

This structure forms like on the open price, the buyers pushed the price to the high price and then the sellers pushed to the low price, and again the buyers came in pushed a little up and closed below the open price. This structure forms like a hanging man in the higher timeframe. So this structure gives less possibility as that it will work in the market.

Note: We have to analyze the hanging man pattern in the higher timeframe. So you can check this pattern structure in the inner timeframe analysis. Hanging man pattern will be formed in all the time frames. It is necessary to check the pattern in a higher timeframe to analyze more and it gives more accuracy to trade.
Now we will be analyzing how the market will perform in this pattern. And how to analyze and take trade with this pattern.

The above image shows the different scenarios in which hanging man can be formed. We will see in detail about these patterns in the upcoming topics.

These 3 bullish candles are not hanging man because there is more buying pressure in these candles. These candles are bullish and the buyers pushed the price to the high price. So these hanging man patterns have very little possibility that it will work in the market.

This bearish candle is considered as hanging man pattern, but it is not recommended to trade in this candle. Because in this candle the lower shadow is too long almost 4 times the real body. So the buying presence is more. If we trade in this candle the possibility is only 50% that the trade will be win or loss based on the structure that we discussed earlier.

Now these two bearish hanging man are perfectly formed. If these patterns are formed based on structure 1, then it has a high probability of getting the market reversed. Other than that if structure 2 is formed we can avoid that pattern as it gives less probability.
Now we will be analyzing how the market will perform in this pattern. And how to analyze and take trade with this pattern.

As you see in the above image the hanging man formed in the high trend. Before the pattern formed there was an uptrend. You can see that the market has full control over the buyer and reached the high price. Then the seller came in pushed the price down, but the buyers fought and pushed the price up and close below the open like a bearish candle.
This pattern should be formed in a higher timeframe. Then we can analyze this pattern in the inner timeframe to check for structure 1. If this pattern is like the formation of structure 1, we have a high possibility that this pattern will work in the market. So we can take a Sell Entry in the next running candle.
If the next candle of the hanging man breaks the previous support trend line, we can get confirmation that the market is going to fall. So we can short the market to make a profit.

The Entry for the Hanging Man Pattern will be above the running candle (that is above the next candle open price of hanging man). If the previous candle’s upper shadow is longer than the hanging man, you can take an entry as shown below in 1.

Or If the previous candle’s upper shadow is shorter than the hanging man, you can take entry between the opening of the running candle and the previous candle high as in 2.
Then as shown above you can take sell entry, as the market will move downside according to our analysis.
The Stop Loss for Hanging Man Pattern will be the high price of the hanging man (2) or previous candle of the hanging man (1).

You can also make a Trailing Stop Loss (1) as the market goes below by drawing a resistance line as shown in the above image.
Step 1: Search for the Hanging man pattern in the higher time frame.
Step 2: Check if the pattern is in a high trend and the prior trend should be an uptrend.
Step 3: Check the Hanging man structure –> it should be bearish –> the lower shadow should be 2 times or 3 times greater than the size of the body with perfect structure formation.
Step 4: Check the structure formation in the inner timeframe of the pattern. If you get the perfect structure move on to the next step.
Step 5: Set entry and stop loss level and execute the trade.
Step 6: Check for confirmation that the previous support line is broken, we also got the confirmation that it is on a high trend, and the structure formation of the hanging man both are perfect so the market will surely move down and we can make a huge profit.
In this video, we dive deep into the Hanging Man Candlestick Pattern, a crucial tool in technical analysis for spotting potential market reversals. Learn how to identify this pattern, its underlying theory, and how it can help you predict bearish trends after an uptrend. We’ll walk you through the structure of the Hanging Man pattern, how to confirm its validity, and the best strategies for trading with it. Whether you’re a beginner or an experienced trader, this video will equip you with the knowledge to use the Hanging Man pattern effectively in your trading setup. Don’t miss out on this essential trading tool that can improve your market timing and decision-making.
ஹேங்கிங் மேன் கொண்டருக்குக் கட்டுப்பாடு வகை | சந்தை மறு திருப்பங்களை கற்றுக்கொள்ளவும்
இந்த வீடியோவில், நாங்கள் ஹேங்கிங் மேன் கொண்டருக்குக் கட்டுப்பாடு வகை குறித்து விரிவாக ஆராய்கிறோம், இது தொழில்நுட்ப பகுப்பாய்வில் சந்தை மறு திருப்பங்களை கண்டறிவதற்கான முக்கியமான கருவியாகும். இந்த வகையை எவ்வாறு அடையாளம் காண்பது, அதன் அடிப்படைத்தியரியம் மற்றும் அது எவ்வாறு பர்மான ஏற்றத்தைத் தொடர்ந்து பத்தல் பிரபலமான இடங்களை கணிக்க உதவுகிறது என்பதை கற்றுக்கொள்ளவும். ஹேங்கிங் மேன் கட்டுப்பாடு வகையின் அமைப்பை எவ்வாறு உறுதிப்படுத்துவது மற்றும் அதனை சரியான வர்த்தகத் திட்டங்களுடன் எவ்வாறு பயன்படுத்துவது என்று நாங்கள் எடுத்துக்காட்டி விளக்குவோம். நீங்கள் ஒரு புதிய பயனர் அல்லது அனுபவம் வாய்ந்த வர்த்தகர் எனப் பாராட்டாதீர்கள், இந்த வீடியோ உங்களுக்கு உங்கள் வர்த்தக பரிந்துரைகளில் இந்த முக்கியமான கொண்டருக்குக் கட்டுப்பாட்டை கையாள உதவும்.
The Hanging Man is a bearish reversal candlestick pattern that appears after an uptrend. It consists of a small real body near the top of the price range, with a long lower shadow. The pattern indicates that despite the price being driven higher during the session, the bears gained control, pushing the price back down, signaling a potential trend reversal to the downside.
To identify a Hanging Man pattern:
It appears in an uptrend.
The candlestick has a small body (either bullish or bearish) located at the top of the price range.
It features a long lower shadow (at least twice the length of the body).
The upper shadow is very short or nonexistent.
The Hanging Man indicates that after an uptrend, there is increasing selling pressure, and the market might be ready to reverse to a downtrend. The pattern shows that although buyers were initially in control, the sellers took over by the end of the session, signaling potential weakness in the prevailing uptrend.
No, the Hanging Man pattern does not always lead to a reversal. It must be confirmed by subsequent price action. For example, a bearish confirmation occurs if the next candlestick closes lower than the body of the Hanging Man. Without confirmation, the pattern may not be reliable.
Entry: Enter a short (sell) position after the confirmation of the Hanging Man pattern. This confirmation can be a bearish candlestick closing below the Hanging Man’s body.
Stop-loss: Place a stop-loss just above the high of the Hanging Man candlestick to protect against false breakouts.
Target: Set a profit target based on support levels or other technical indicators such as the Relative Strength Index (RSI) or moving averages.
Both patterns look similar, but the key difference is their location:
Hanging Man: Appears after an uptrend and signals a potential reversal to the downside.
Inverted Hammer: Appears after a downtrend and signals a potential reversal to the upside.
The pattern must form in a strong uptrend.
The longer the lower shadow, the stronger the signal.
Confirmation from the next candlestick or two is essential for increasing reliability.
A significant price reversal (not just a temporary pullback) should be expected after the pattern is confirmed.
Yes, the Hanging Man pattern can be used in all timeframes, but it is most reliable on higher timeframes (e.g., daily or weekly charts), as the patterns on smaller timeframes may lead to more false signals.
It can generate false signals if not confirmed by the following candles.
It is not a guaranteed predictor of a trend reversal; market conditions and other indicators should be considered.
In isolation, the pattern may not be enough for a confident trade decision.
While the Hanging Man pattern is an excellent tool, beginners should combine it with other technical indicators and risk management strategies. It is important to wait for confirmation and to practice proper stop-loss management to minimize potential losses.


Coinrule is a creative platform that allows users to create automated trading strategies across multiple exchanges through a user-friendly interface and a range of indicators that users can use to pre-plan their crypto trading.
There is no need for users to sit in front of charts for hours with Coinrule because there are no coding skills required. Anyone can use it.
Coinrule provides users with the ability to execute trades automatically based on predefined conditions as well as the option to trade manually.
The coinrule offers four pricing plans such as Starter, Hobbyist, Trader, and Pro.
The Strategy Templates are pre-defined and it is created by experienced traders based on popular trading strategies so users can set buy and sell orders based on market conditions.
The coinrule allows users to customize their own strategies and rules to trade in the cryptocurrency market.
Coinrule is also available on the Google Play Store(Coinrule Crypto Trading Bot).
A risk management strategy is a set of practices that every trader or investor needs to follow to minimize the overall risk of the positions they are taking daily.

It allows users to create custom trading rules and it also allows the users to create automated rules across coins.
The Coinrule is a platform that is useful for a wide variety of traders. It offers a wide range of opportunities for users to plan their trading system and buy and sell NEM easily and automatically. Users can test and develop their automatic strategies to purchase and sell NEM automatically as they like.
Coinrule offers four pricing and plans

In coinrule offers, the starter plan fully free. It allows users to access 2 live rules, 2 demo rules,7 template strategies, 1 connected exchange, and some more offers.
The Hobbyist pricing plan offers users to access 7 live rules, 7 demo rules, 40 template strategies, 3 connected exchanges, up to $ 500k monthly trade volume, leverage trading, and some more offers.
The Trader pricing plan offers users to access 25 live rules, 25 demo rules, unlimited template strategies, 5 connected exchanges, up to $ 10M monthly trade volume, leverage trading, live telegram notifications, free access to the trader community, and some more offers.
The pro pricing plan offers users to access 50 live rules, 50 demo rules, unlimited template strategies, unlimited exchanges, unlimited trade volume, leverage trading, live telegram + text notifications, free access to the trader community, ultra-fast execution dedicated server trading view integration, and some more offers.
Users need to pay attention to the terms of use as they provide, very important information about the users’ rights and obligations, as well as conditions, limitations, and exclusions, and should be read carefully before accessing or using the Software. By using this Software in any way and for any purpose, with or without an account, and from any device and location, users need to accept and acknowledge that.
Coinrule is an automated cryptocurrency trading platform designed to help users create and execute trading strategies without needing advanced technical knowledge. It allows users to automate trades on multiple exchanges like Binance, Coinbase Pro, Kraken, and more.
Coinrule works by allowing users to set up customized trading rules based on different market conditions. Users can define rules for buying, selling, or holding specific cryptocurrencies. These rules are then executed automatically by the bot on supported exchanges based on pre-set criteria, such as price movements, trends, or other indicators.
Coinrule supports a wide range of cryptocurrency exchanges, including:
Binance
Coinbase Pro
Kraken
KuCoin
Bitstamp
Gemini
And many more.
No, Coinrule is designed for users of all skill levels. It offers a user-friendly interface where you can create automated trading strategies using a simple “If/Then” rule format. No coding knowledge is required.
Coinrule allows users to create a wide range of strategies, such as:
Trend-following strategies
Market-making strategies
Arbitrage strategies
Risk management rules (stop-loss, take-profit)
Custom alerts and notifications
Yes, Coinrule prioritizes the security of your funds and data. The platform connects to exchanges via API keys, which only allow access to your trading account without providing access to your funds. You retain full control over your crypto holdings, and Coinrule never asks for withdrawal permissions.
Coinrule offers multiple pricing plans:
Free Plan: Limited to one rule with basic features.
Pro Plan: Offers advanced features, more rules, and higher limits on trading activity.
Advanced Plan: Includes premium features, extra security options, and priority support.
The exact cost depends on the plan you choose, with options for monthly or annual payments.
Yes, Coinrule has a mobile app available for both iOS and Android devices. This allows you to create, monitor, and adjust your trading strategies on the go.
Some of the key features include:
Customizable Trading Rules: Create rules based on market conditions.
Backtesting: Test your strategies using historical data.
Portfolio Management: Track your crypto portfolio and profits.
Multi-Exchange Support: Manage trades across different exchanges in one platform.
Security: Encrypted API connections with no withdrawal permissions.
Coinrule supports trading on a wide range of cryptocurrencies available on its supported exchanges. However, the specific available coins may vary depending on the exchange and market conditions.
Yes, Coinrule is designed to be beginner-friendly. The platform provides an easy-to-use interface and offers pre-configured trading templates that new users can quickly implement. The “If/Then” logic makes it accessible for anyone looking to automate their trades.
To get started:
Sign up for a Coinrule account.
Connect your exchange account via API keys.
Create your first trading rule using the “If/Then” logic.
Set your preferred parameters, such as trading pairs and risk management settings.
Let Coinrule execute the trades automatically on your behalf.
Yes, you can pause or stop your automated trading bot at any time. Coinrule provides full control over your trading activity, so you can disable or adjust your strategies whenever you need.
Yes, Coinrule provides customer support through multiple channels, including email and a help center with FAQs and tutorials. For users on the Pro and Advanced plans, premium support is also available.
Yes, Coinrule offers advanced features and tools for professional traders, such as backtesting, custom strategies, and multiple exchange support. However, it is also designed for beginners, so traders of all skill levels can benefit from the platform.
Yes, Coinrule provides portfolio management features that allow you to track your portfolio’s performance across various exchanges and trading pairs. This helps you understand your overall portfolio performance and make more informed trading decisions.
Coinrule uses industry-standard security practices, including:
Two-factor authentication (2FA) for account protection.
Encrypted API connections to ensure secure communication between the platform and exchanges.
No withdrawal access, so your funds are always secure in your exchange account.
Yes, Coinrule offers a free plan with limited features, allowing you to try out the platform and experiment with automated trading before deciding if a paid plan is right for you.
Yes, Coinrule supports strategies based on various technical indicators such as moving averages, RSI, MACD, and more. You can create complex rules using these indicators to automate trading decisions.
Backtesting allows you to test your trading strategies using historical data to see how they would have performed in the past. Coinrule offers a backtesting feature that lets you simulate trades based on different parameters, helping you refine your strategies before going live.
The Coinrule is software that allows users to create automated trading strategies across multiple exchanges. It offers four types of pricing and planning. By using this software users do not need to sit and watch the charts for hours. It is a user-friendly software and it is also available in a mobile app(Coinrule Crypto Trading Bot).
To check out the Coinrule, Click here.