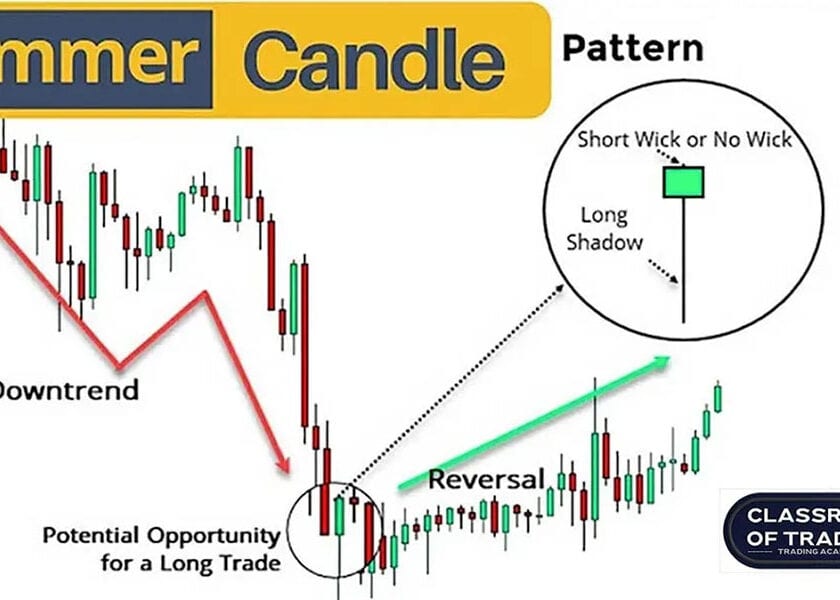
The Fibonacci retracement strategy is a trading method used to master market pullbacks by identifying support and resistance levels with key ratios like 38.2%, 50%, and 61.8%. Traders apply these levels to predict where prices may pause, reverse, or continue, making it easier to plan entries, exits, and profit targets across stocks, forex, and crypto markets. This simple yet powerful approach works best when combined with tools like price action, Elliott Wave Theory, and trend analysis.
Fibonacci retracement strategy
Introduction: Why Fibonacci Matters in Trading
Every trader faces the same question: when to enter and when to exit the market. Prices rarely move in straight lines—they rise, pull back, and then continue. The Fibonacci retracement strategy helps traders forecast these pullbacks with surprising accuracy.
Derived from the Fibonacci sequence and its golden ratio (61.8%), this method identifies areas where prices are likely to retrace before resuming their main trend. Whether you trade stocks, forex, or crypto, Fibonacci retracements provide a roadmap to navigate volatile markets.

Chapter 1: The Basics of Fibonacci in Trading
The Fibonacci sequence is a mathematical pattern (0, 1, 1, 2, 3, 5, 8, 13…) where each number is the sum of the two before it. From this sequence, traders use ratios like:
- 23.6%
- 38.2%
- 50% (not Fibonacci but widely used)
- 61.8% (Golden Ratio)
- 78.6%
These ratios reveal likely support and resistance zones in price action.
Chapter 2: What Is a Fibonacci Retracement Strategy?
The Fibonacci retracement strategy is the practice of applying these ratios to forecast market behavior. It helps traders:
- Identify pullback levels
- Time entries and exits
- Place stop-loss orders effectively
- Forecast potential continuation or reversal points
Think of it as a map: If a stock climbs and then dips, Fibonacci shows where buyers may step back in.
Chapter 3: How to Use Fibonacci Retracement in Trading
Step 1: Identify a trend
Find a clear upward or downward trend.
Step 2: Apply the Fibonacci tool
- In an uptrend → Draw from swing low to swing high
- In a downtrend → Draw from swing high to swing low
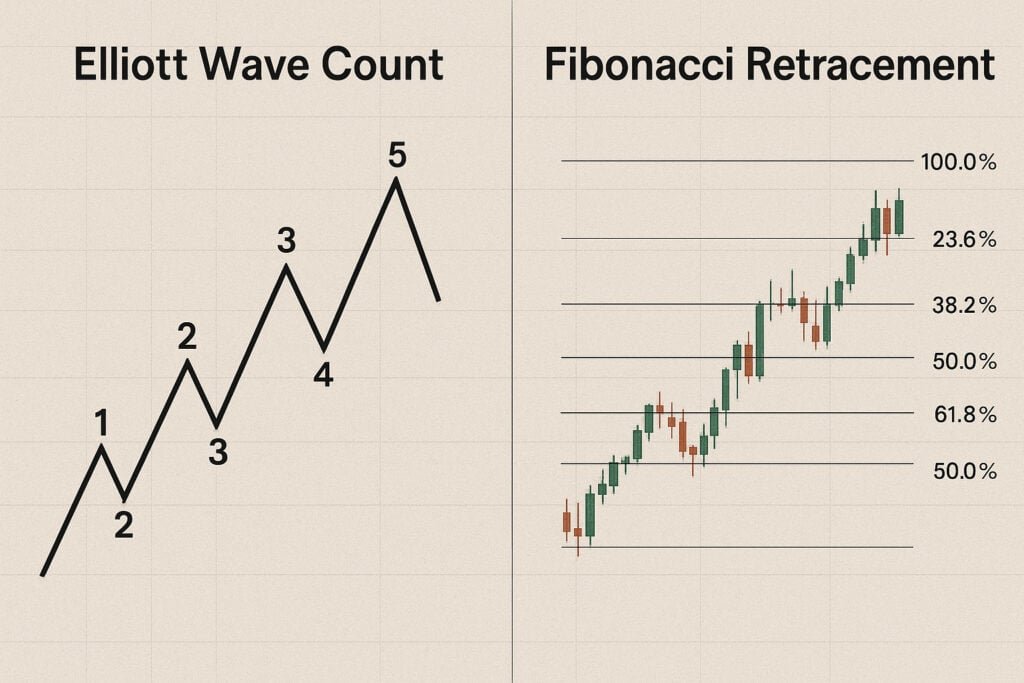
Step 3: Watch the retracement levels
- 38.2% → Shallow pullback
- 50% → Moderate correction
- 61.8% → Deep retracement, golden pocket
Step 4: Look for confirmation
Use candlestick signals, trendlines, or moving averages for confirmation before entering.
Chapter 4: Why Fibonacci Retracement Works
Fibonacci works because of market psychology:
- Many traders watch the same levels
- Institutions set orders near these ratios
- Other trading systems, like Elliott Wave Theory, also rely on them
It’s less about magic and more about crowd behavior.
Chapter 5: Advanced Fibonacci Trading Techniques
Fibonacci Extensions
Used to project profit targets after retracements. Levels include 127.2%, 161.8%, and 261.8%.
Fibonacci Confluence
When Fibonacci levels overlap with support, resistance, or moving averages, the signal is stronger.
Harmonic Patterns
Patterns like Gartley, Bat, and Butterfly are built entirely on Fibonacci ratios, helping traders spot reversals.
Elliott Wave + Fibonacci
Wave structures often align with Fibonacci. For instance, Wave 2 often retraces 61.8%, and Wave 4 retraces 38.2%.
Chapter 6: Risk Management with Fibonacci
- Always place stop-loss orders just beyond Fibonacci levels
- Risk only 1–2% of account balance per trade
- Combine Fibonacci with confirmation signals—never trade it alone
Chapter 7: Practical Examples
Example 1: Stock Market
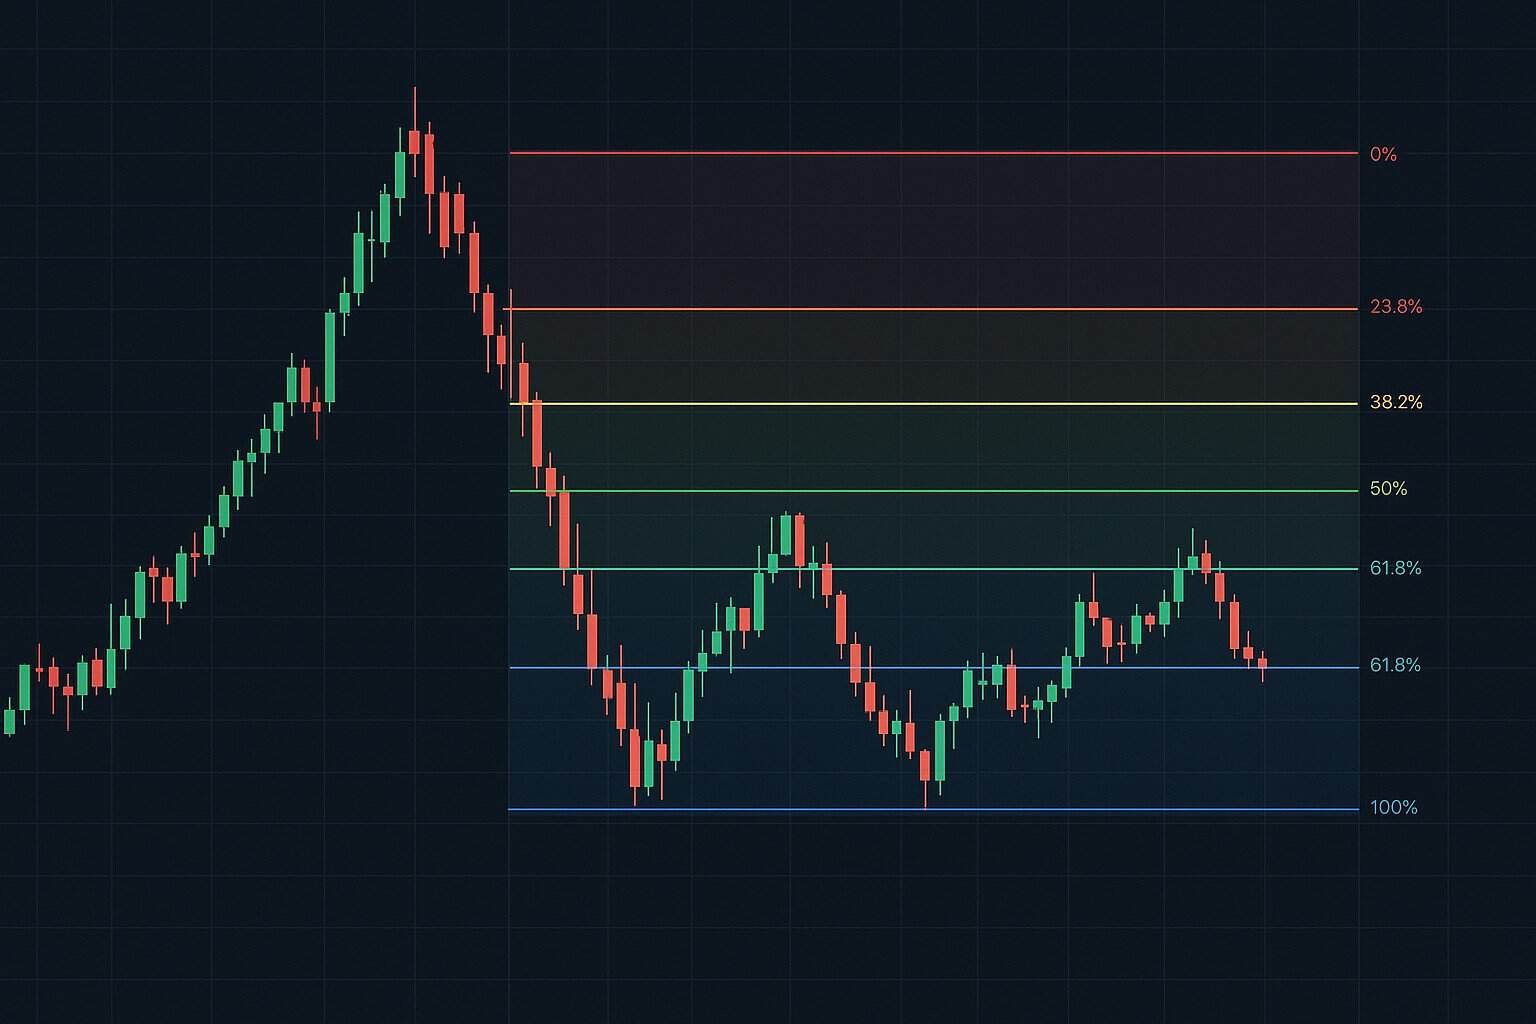
A stock rises from ₹100 to ₹200. Retracement to 61.8% (₹138) shows buyers stepping back in.
Example 2: Forex
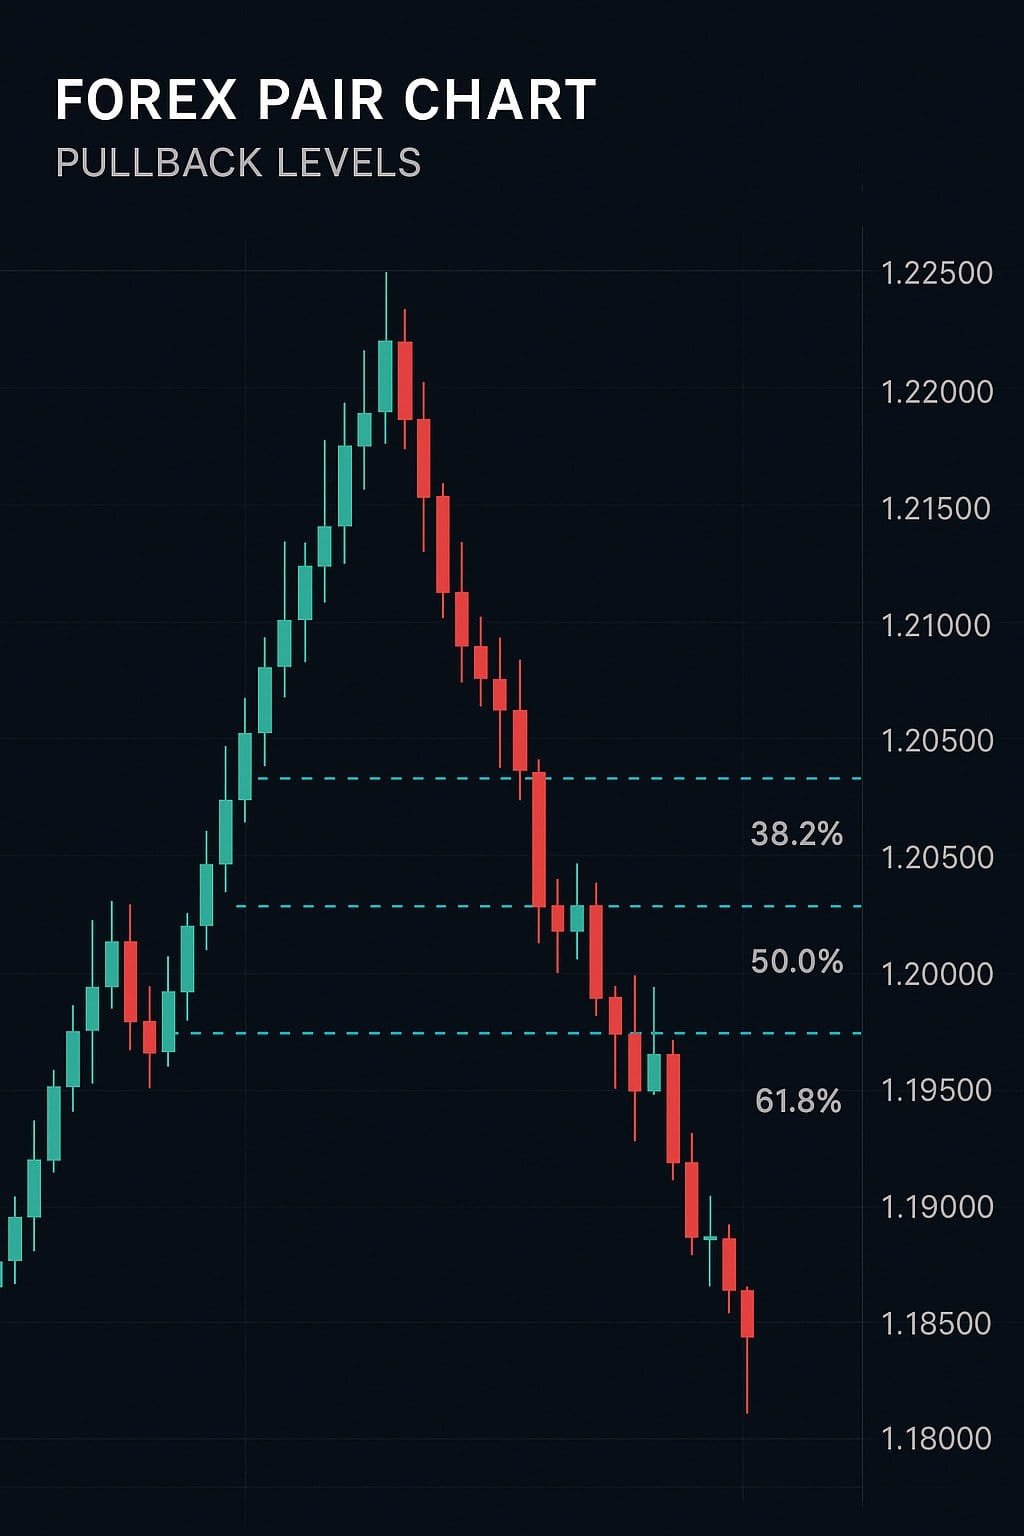
EUR/USD rallies from 1.0500 to 1.0800. It retraces to 50% (1.0650) and continues upward.
Example 3: Crypto
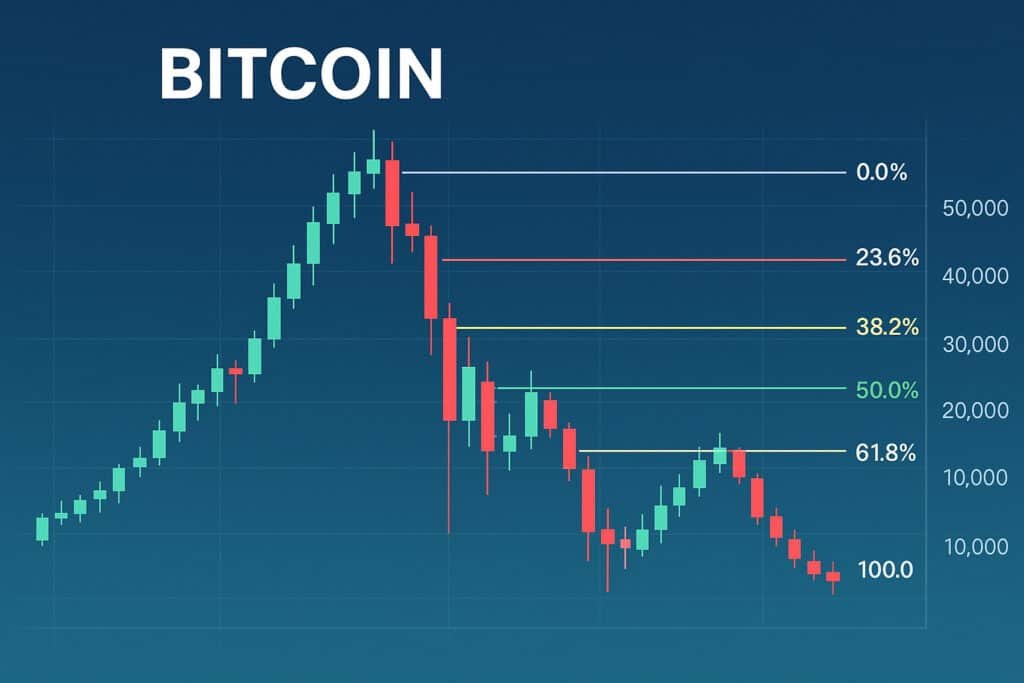
Bitcoin climbs from $20,000 to $25,000. Retracement to $22,500 (50% level) becomes the launchpad for the next rally.
Chapter 8: Common Mistakes to Avoid
- Trading Fibonacci in a sideways market
- Expecting exact price reversals instead of zones
- Ignoring trend direction
- Overcomplicating charts with too many levels
Chapter 9: Learning Fibonacci the Right Way
Learn Fibonacci Retracement with the Best Trading Course in Chennai
Mastering Fibonacci requires more than theory. By joining the best trading course in Chennai, traders can practice applying retracement tools alongside candlestick patterns, Elliott Wave Theory, and price action trading. Courses provide real-market case studies, helping traders learn how retracements work across stocks, forex, and crypto.
Why the Best Trading Course in Chennai Enhances Your Skills
While self-learning works, structured mentorship accelerates progress. A best trading course in Chennai gives hands-on training, live market exposure, and personalized feedback. This helps traders avoid mistakes, apply Fibonacci confidently, and combine it with swing trading and intraday setups for consistent performance.
FAQs
1. What is the Fibonacci retracement strategy in trading?
The Fibonacci retracement strategy uses ratios like 38.2%, 50%, and 61.8% to spot support and resistance zones during pullbacks.
2. Why is Fibonacci retracement important in trading?
It helps traders forecast where corrections may end, allowing better entry and exit planning.
3. What are the most commonly used Fibonacci retracement levels?
23.6%, 38.2%, 50%, 61.8%, and 78.6%.
4. How do traders draw Fibonacci retracement levels?
In an uptrend, draw from swing low to swing high. In a downtrend, draw from swing high to swing low.
5. Can Fibonacci retracement be used in forex trading?
Yes, it’s widely used to identify pullbacks in currency pairs.
6. Is Fibonacci retracement useful for stock trading?
Absolutely—it helps identify dips in uptrends and profit-taking points in downtrends.
7. Does Fibonacci retracement work in crypto markets?
Yes, Bitcoin and other cryptos often respect Fibonacci zones.
8. What is the 61.8% Fibonacci level?
It’s the golden ratio—considered a strong reversal level.
9. Is the 50% retracement level a Fibonacci number?
No, but it’s used because markets often retrace about half a move.
10. How accurate is Fibonacci retracement strategy?
It’s not 100% accurate; best used with confirmation tools.
11. Can Fibonacci retracement predict exact price points?
No. It shows zones of interest, not exact numbers.
12. What’s the difference between Fibonacci retracement and extension?
Retracement shows pullbacks, extensions project targets.
13. How do I use Fibonacci retracement with Elliott Wave Theory?
Waves often align with Fibonacci—like Wave 2 retracing 61.8%.
14. What are Fibonacci confluence zones?
Areas where multiple Fibonacci levels overlap with other signals.
15. Can beginners use Fibonacci retracement strategy?
Yes, but practice with demo accounts is recommended first.
16. What are common mistakes with Fibonacci retracement?
Using it in sideways markets, ignoring trend, expecting precision.
17. Can Fibonacci retracement be used for intraday trading?
Yes, on smaller timeframes like 15-min or 1-hour charts.
18. How can I combine Fibonacci retracement with price action?
Look for candle patterns, breakouts, or retests near Fibonacci levels.
20. Where can I learn Fibonacci retracement strategy in depth?
Online resources are good, but structured programs like the best trading course in Chennai provide expert mentorship.
Conclusion
The Fibonacci retracement strategy is one of the most reliable tools for mastering market pullbacks. By using ratios like 38.2%, 50%, and 61.8%, traders can forecast retracements, spot reversal zones, and set profit targets.
When combined with price action, Elliott Wave, and proper risk management, Fibonacci retracement turns from a simple math concept into a practical trading strategy. For deeper learning, structured programs such as the best trading course in Chennai provide the skills and confidence needed to trade like a professional.


