
24 Oct
Advance Hanging man Pattern
In this blog, we are going to see about the Hanging Man Pattern, which is one of the Japanese candlestick charting techniques. We will deeply describe the Hanging Man Pattern formation, structure, theory, and techniques to analyze the pattern.
You will learn more about the Hanging Man Pattern in detail, which you could use in your trading technique. So read the full blog to get a better understanding of the pattern and techniques. Let’s dive into the concept.
Table of Contents
Introduction of Hanging Man Pattern

The Hanging Man Pattern is a trend reversal pattern. It is formed on the High Trend in the chart. So the prior trend should be an uptrend. If this pattern is formed in the high trend, it has the possibility that this pattern will work 70% in the market.

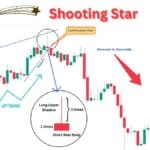
Hanging Man has a small real body and a long lower shadow. The body of the hanging man should be 3 times shorter than the lower shadow or the lower shadow must be 3 times longer than the hanging man body. That is, if the body is 1 time the size means the lower shadow must be 3 times longer than the size of the body. For the bearish candle, the open price will be greater than the close price.

Note: If the candle of this pattern is in a bullish candle, it is not considered as a hanging man pattern. The reason for this will be explained in detail in the upcoming topic.
Structure of Hanging Man Pattern
Now we will see how the Hanging Man Pattern structure should be formed.
Structure 1 – OLHC
This structure tells about the presence of buyers and sellers in the pattern. On the open price, the sellers pushed the price down to the low price and then the buyers took control of the market and pushed to the high price, and again the seller came in pushed a little down and closed below the open price. This structure forms like a hanging man in the higher timeframe. So if this structure is formed inside the hanging man, the pattern has a strong possibility that it will work 80% and will give a sell signal as the market will move downside. We have to check this structure in the inner timeframe of the hanging man.

Structure 2 – OHLC
This structure forms like on the open price, the buyers pushed the price to the high price and then the sellers pushed to the low price, and again the buyers came in pushed a little up and closed below the open price. This structure forms like a hanging man in the higher timeframe. So this structure gives less possibility as that it will work in the market.

Note: We have to analyze the hanging man pattern in the higher timeframe. So you can check this pattern structure in the inner timeframe analysis. Hanging man pattern will be formed in all the time frames. It is necessary to check the pattern in a higher timeframe to analyze more and it gives more accuracy to trade.
Different scenarios in which Hanging Man can be formed.
Now we will be analyzing how the market will perform in this pattern. And how to analyze and take trade with this pattern.

The above image shows the different scenarios in which hanging man can be formed. We will see in detail about these patterns in the upcoming topics.
Why these 3 Bullish Hanging Man are Wrong

These 3 bullish candles are not hanging man because there is more buying pressure in these candles. These candles are bullish and the buyers pushed the price to the high price. So these hanging man patterns have very little possibility that it will work in the market.
Why this long lower shadow Bearish hanging man is wrong

This bearish candle is considered as hanging man pattern, but it is not recommended to trade in this candle. Because in this candle the lower shadow is too long almost 4 times the real body. So the buying presence is more. If we trade in this candle the possibility is only 50% that the trade will be win or loss based on the structure that we discussed earlier.
Why this 2 hanging man are Correct

Now these two bearish hanging man are perfectly formed. If these patterns are formed based on structure 1, then it has a high probability of getting the market reversed. Other than that if structure 2 is formed we can avoid that pattern as it gives less probability.
Theory of Hanging Man Pattern
Now we will be analyzing how the market will perform in this pattern. And how to analyze and take trade with this pattern.

As you see in the above image the hanging man formed in the high trend. Before the pattern formed there was an uptrend. You can see that the market has full control over the buyer and reached the high price. Then the seller came in pushed the price down, but the buyers fought and pushed the price up and close below the open like a bearish candle.
This pattern should be formed in a higher timeframe. Then we can analyze this pattern in the inner timeframe to check for structure 1. If this pattern is like the formation of structure 1, we have a high possibility that this pattern will work in the market. So we can take a Sell Entry in the next running candle.
Confirmation of Hanging Man Pattern
If the next candle of the hanging man breaks the previous support trend line, we can get confirmation that the market is going to fall. So we can short the market to make a profit.

Entry for Hanging Man Pattern
The Entry for the Hanging Man Pattern will be above the running candle (that is above the next candle open price of hanging man). If the previous candle’s upper shadow is longer than the hanging man, you can take an entry as shown below in 1.

Or If the previous candle’s upper shadow is shorter than the hanging man, you can take entry between the opening of the running candle and the previous candle high as in 2.
Then as shown above you can take sell entry, as the market will move downside according to our analysis.
Stop Loss for Hanging Man Pattern
The Stop Loss for Hanging Man Pattern will be the high price of the hanging man (2) or previous candle of the hanging man (1).

You can also make a Trailing Stop Loss (1) as the market goes below by drawing a resistance line as shown in the above image.
Steps to check before taking the entry with hanging man pattern.
Step 1: Search for the Hanging man pattern in the higher time frame.
Step 2: Check if the pattern is in a high trend and the prior trend should be an uptrend.
Step 3: Check the Hanging man structure –> it should be bearish –> the lower shadow should be 2 times or 3 times greater than the size of the body with perfect structure formation.
Step 4: Check the structure formation in the inner timeframe of the pattern. If you get the perfect structure move on to the next step.
Step 5: Set entry and stop loss level and execute the trade.
Step 6: Check for confirmation that the previous support line is broken, we also got the confirmation that it is on a high trend, and the structure formation of the hanging man both are perfect so the market will surely move down and we can make a huge profit.
Video Tutorials
Hanging Man Candlestick Pattern Explained in English | Learn Market Reversals
In this video, we dive deep into the Hanging Man Candlestick Pattern, a crucial tool in technical analysis for spotting potential market reversals. Learn how to identify this pattern, its underlying theory, and how it can help you predict bearish trends after an uptrend. We’ll walk you through the structure of the Hanging Man pattern, how to confirm its validity, and the best strategies for trading with it. Whether you’re a beginner or an experienced trader, this video will equip you with the knowledge to use the Hanging Man pattern effectively in your trading setup. Don’t miss out on this essential trading tool that can improve your market timing and decision-making.
ஹேங்கிங் மேன் கொண்டருக்குக் கட்டுப்பாடு வகை | சந்தை மறு திருப்பங்களை கற்றுக்கொள்ளவும்
இந்த வீடியோவில், நாங்கள் ஹேங்கிங் மேன் கொண்டருக்குக் கட்டுப்பாடு வகை குறித்து விரிவாக ஆராய்கிறோம், இது தொழில்நுட்ப பகுப்பாய்வில் சந்தை மறு திருப்பங்களை கண்டறிவதற்கான முக்கியமான கருவியாகும். இந்த வகையை எவ்வாறு அடையாளம் காண்பது, அதன் அடிப்படைத்தியரியம் மற்றும் அது எவ்வாறு பர்மான ஏற்றத்தைத் தொடர்ந்து பத்தல் பிரபலமான இடங்களை கணிக்க உதவுகிறது என்பதை கற்றுக்கொள்ளவும். ஹேங்கிங் மேன் கட்டுப்பாடு வகையின் அமைப்பை எவ்வாறு உறுதிப்படுத்துவது மற்றும் அதனை சரியான வர்த்தகத் திட்டங்களுடன் எவ்வாறு பயன்படுத்துவது என்று நாங்கள் எடுத்துக்காட்டி விளக்குவோம். நீங்கள் ஒரு புதிய பயனர் அல்லது அனுபவம் வாய்ந்த வர்த்தகர் எனப் பாராட்டாதீர்கள், இந்த வீடியோ உங்களுக்கு உங்கள் வர்த்தக பரிந்துரைகளில் இந்த முக்கியமான கொண்டருக்குக் கட்டுப்பாட்டை கையாள உதவும்.
1. What is the Hanging Man Candlestick Pattern?
The Hanging Man is a bearish reversal candlestick pattern that appears after an uptrend. It consists of a small real body near the top of the price range, with a long lower shadow. The pattern indicates that despite the price being driven higher during the session, the bears gained control, pushing the price back down, signaling a potential trend reversal to the downside.
2. How do you identify the Hanging Man Candlestick Pattern?
To identify a Hanging Man pattern:
It appears in an uptrend.
The candlestick has a small body (either bullish or bearish) located at the top of the price range.
It features a long lower shadow (at least twice the length of the body).
The upper shadow is very short or nonexistent.
3. What does the Hanging Man pattern indicate?
The Hanging Man indicates that after an uptrend, there is increasing selling pressure, and the market might be ready to reverse to a downtrend. The pattern shows that although buyers were initially in control, the sellers took over by the end of the session, signaling potential weakness in the prevailing uptrend.
4. Is the Hanging Man pattern always a sign of a market reversal?
No, the Hanging Man pattern does not always lead to a reversal. It must be confirmed by subsequent price action. For example, a bearish confirmation occurs if the next candlestick closes lower than the body of the Hanging Man. Without confirmation, the pattern may not be reliable.
5. How do you trade the Hanging Man Candlestick Pattern?
Entry: Enter a short (sell) position after the confirmation of the Hanging Man pattern. This confirmation can be a bearish candlestick closing below the Hanging Man’s body.
Stop-loss: Place a stop-loss just above the high of the Hanging Man candlestick to protect against false breakouts.
Target: Set a profit target based on support levels or other technical indicators such as the Relative Strength Index (RSI) or moving averages.
6. What are the differences between a Hanging Man and an Inverted Hammer?
Both patterns look similar, but the key difference is their location:
Hanging Man: Appears after an uptrend and signals a potential reversal to the downside.
Inverted Hammer: Appears after a downtrend and signals a potential reversal to the upside.
7. What are the key conditions for the Hanging Man pattern to be effective?
The pattern must form in a strong uptrend.
The longer the lower shadow, the stronger the signal.
Confirmation from the next candlestick or two is essential for increasing reliability.
A significant price reversal (not just a temporary pullback) should be expected after the pattern is confirmed.
8. Can the Hanging Man pattern be used in all timeframes?
Yes, the Hanging Man pattern can be used in all timeframes, but it is most reliable on higher timeframes (e.g., daily or weekly charts), as the patterns on smaller timeframes may lead to more false signals.
9. What are the limitations of the Hanging Man pattern?
It can generate false signals if not confirmed by the following candles.
It is not a guaranteed predictor of a trend reversal; market conditions and other indicators should be considered.
In isolation, the pattern may not be enough for a confident trade decision.
10. Is the Hanging Man pattern a good strategy for beginners?
While the Hanging Man pattern is an excellent tool, beginners should combine it with other technical indicators and risk management strategies. It is important to wait for confirmation and to practice proper stop-loss management to minimize potential losses.