Category: Technical Analysis

best trading course in chennai

Fibonacci Retracement Strategy: Master Market Pullbacks

The Fibonacci retracement strategy is a trading method used to master market pullbacks by identifying support and resistance levels with key ratios like 38.2%, 50%, and 61.8%. Traders apply these levels to predict where prices may pause, reverse, or continue, making it easier to plan entries, exits, and profit targets across stocks, forex, and crypto markets. This simple yet powerful approach works best when combined with tools like price action, Elliott Wave Theory, and trend analysis.

Fibonacci retracement strategy


Introduction: Why Fibonacci Matters in Trading

Every trader faces the same question: when to enter and when to exit the market. Prices rarely move in straight lines—they rise, pull back, and then continue. The Fibonacci retracement strategy helps traders forecast these pullbacks with surprising accuracy.

Derived from the Fibonacci sequence and its golden ratio (61.8%), this method identifies areas where prices are likely to retrace before resuming their main trend. Whether you trade stocks, forex, or crypto, Fibonacci retracements provide a roadmap to navigate volatile markets.

best trading course in Chennai

Chapter 1: The Basics of Fibonacci in Trading

The Fibonacci sequence is a mathematical pattern (0, 1, 1, 2, 3, 5, 8, 13…) where each number is the sum of the two before it. From this sequence, traders use ratios like:

  • 23.6%
  • 38.2%
  • 50% (not Fibonacci but widely used)
  • 61.8% (Golden Ratio)
  • 78.6%

These ratios reveal likely support and resistance zones in price action.


Chapter 2: What Is a Fibonacci Retracement Strategy?

The Fibonacci retracement strategy is the practice of applying these ratios to forecast market behavior. It helps traders:

  • Identify pullback levels
  • Time entries and exits
  • Place stop-loss orders effectively
  • Forecast potential continuation or reversal points

Think of it as a map: If a stock climbs and then dips, Fibonacci shows where buyers may step back in.


Chapter 3: How to Use Fibonacci Retracement in Trading

Step 1: Identify a trend
Find a clear upward or downward trend.

Step 2: Apply the Fibonacci tool

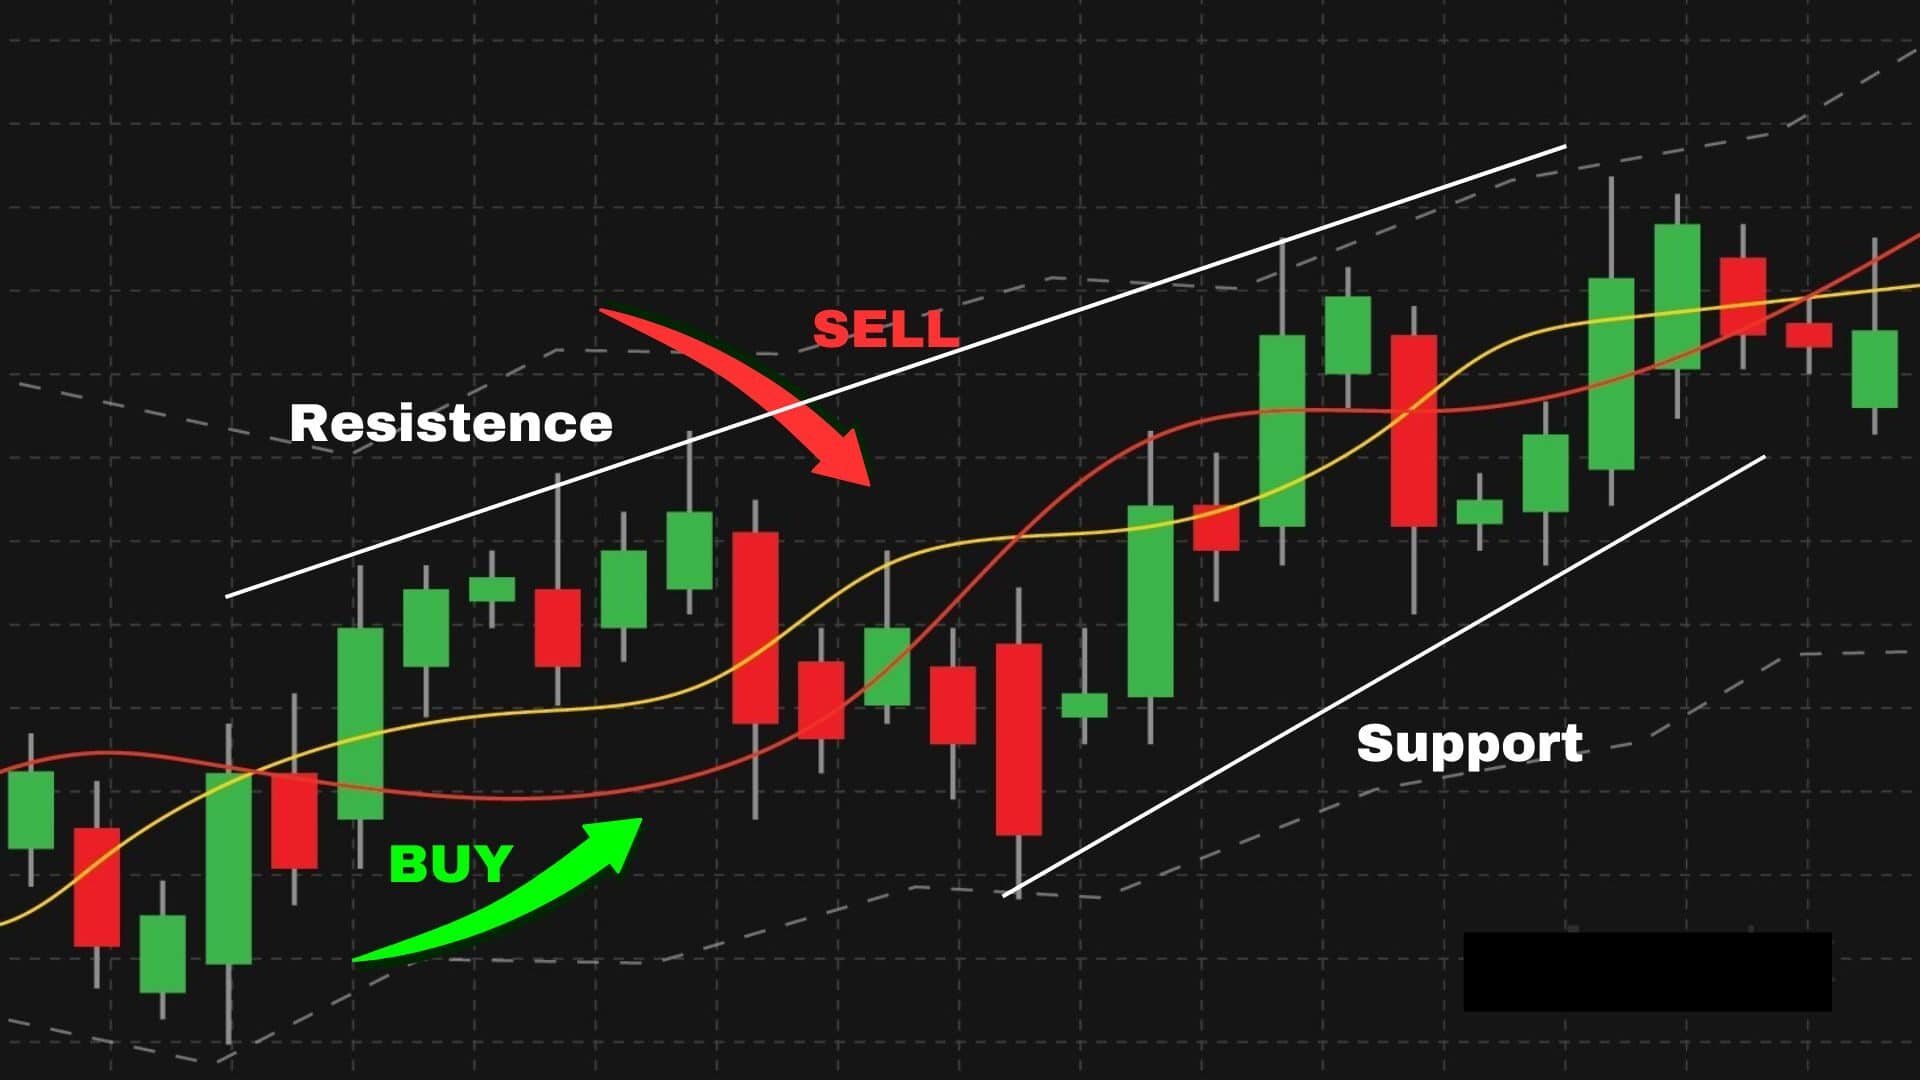
  • In an uptrend → Draw from swing low to swing high
  • In a downtrend → Draw from swing high to swing low

Step 3: Watch the retracement levels

  • 38.2% → Shallow pullback
  • 50% → Moderate correction
  • 61.8% → Deep retracement, golden pocket

Step 4: Look for confirmation
Use candlestick signals, trendlines, or moving averages for confirmation before entering.


Chapter 4: Why Fibonacci Retracement Works

Fibonacci works because of market psychology:

  • Many traders watch the same levels
  • Institutions set orders near these ratios
  • Other trading systems, like Elliott Wave Theory, also rely on them

It’s less about magic and more about crowd behavior.


Chapter 5: Advanced Fibonacci Trading Techniques

Fibonacci Extensions

Used to project profit targets after retracements. Levels include 127.2%, 161.8%, and 261.8%.

Fibonacci Confluence

When Fibonacci levels overlap with support, resistance, or moving averages, the signal is stronger.

Harmonic Patterns

Patterns like Gartley, Bat, and Butterfly are built entirely on Fibonacci ratios, helping traders spot reversals.

Elliott Wave + Fibonacci

Wave structures often align with Fibonacci. For instance, Wave 2 often retraces 61.8%, and Wave 4 retraces 38.2%.


Chapter 6: Risk Management with Fibonacci

  • Always place stop-loss orders just beyond Fibonacci levels
  • Risk only 1–2% of account balance per trade
  • Combine Fibonacci with confirmation signals—never trade it alone

Chapter 7: Practical Examples

Example 1: Stock Market

Fibonacci retracement strategy

A stock rises from ₹100 to ₹200. Retracement to 61.8% (₹138) shows buyers stepping back in.

Example 2: Forex

Fibonacci retracement strategy

EUR/USD rallies from 1.0500 to 1.0800. It retraces to 50% (1.0650) and continues upward.

Example 3: Crypto

Fibonacci retracement strategy

Bitcoin climbs from $20,000 to $25,000. Retracement to $22,500 (50% level) becomes the launchpad for the next rally.


Chapter 8: Common Mistakes to Avoid

  1. Trading Fibonacci in a sideways market
  2. Expecting exact price reversals instead of zones
  3. Ignoring trend direction
  4. Overcomplicating charts with too many levels

Chapter 9: Learning Fibonacci the Right Way

Learn Fibonacci Retracement with the Best Trading Course in Chennai

Mastering Fibonacci requires more than theory. By joining the best trading course in Chennai, traders can practice applying retracement tools alongside candlestick patterns, Elliott Wave Theory, and price action trading. Courses provide real-market case studies, helping traders learn how retracements work across stocks, forex, and crypto.

Why the Best Trading Course in Chennai Enhances Your Skills

While self-learning works, structured mentorship accelerates progress. A best trading course in Chennai gives hands-on training, live market exposure, and personalized feedback. This helps traders avoid mistakes, apply Fibonacci confidently, and combine it with swing trading and intraday setups for consistent performance.


FAQs

1. What is the Fibonacci retracement strategy in trading?

The Fibonacci retracement strategy uses ratios like 38.2%, 50%, and 61.8% to spot support and resistance zones during pullbacks.

2. Why is Fibonacci retracement important in trading?

It helps traders forecast where corrections may end, allowing better entry and exit planning.

3. What are the most commonly used Fibonacci retracement levels?

23.6%, 38.2%, 50%, 61.8%, and 78.6%.

4. How do traders draw Fibonacci retracement levels?

In an uptrend, draw from swing low to swing high. In a downtrend, draw from swing high to swing low.

5. Can Fibonacci retracement be used in forex trading?

Yes, it’s widely used to identify pullbacks in currency pairs.

6. Is Fibonacci retracement useful for stock trading?

Absolutely—it helps identify dips in uptrends and profit-taking points in downtrends.

7. Does Fibonacci retracement work in crypto markets?

Yes, Bitcoin and other cryptos often respect Fibonacci zones.

8. What is the 61.8% Fibonacci level?

It’s the golden ratio—considered a strong reversal level.

9. Is the 50% retracement level a Fibonacci number?

No, but it’s used because markets often retrace about half a move.

10. How accurate is Fibonacci retracement strategy?

It’s not 100% accurate; best used with confirmation tools.

11. Can Fibonacci retracement predict exact price points?

No. It shows zones of interest, not exact numbers.

12. What’s the difference between Fibonacci retracement and extension?

Retracement shows pullbacks, extensions project targets.

13. How do I use Fibonacci retracement with Elliott Wave Theory?

Waves often align with Fibonacci—like Wave 2 retracing 61.8%.

14. What are Fibonacci confluence zones?

Areas where multiple Fibonacci levels overlap with other signals.

15. Can beginners use Fibonacci retracement strategy?

Yes, but practice with demo accounts is recommended first.

16. What are common mistakes with Fibonacci retracement?

Using it in sideways markets, ignoring trend, expecting precision.

17. Can Fibonacci retracement be used for intraday trading?

Yes, on smaller timeframes like 15-min or 1-hour charts.

18. How can I combine Fibonacci retracement with price action?

Look for candle patterns, breakouts, or retests near Fibonacci levels.

20. Where can I learn Fibonacci retracement strategy in depth?

Online resources are good, but structured programs like the best trading course in Chennai provide expert mentorship.

best trading course in Chenna

Conclusion

The Fibonacci retracement strategy is one of the most reliable tools for mastering market pullbacks. By using ratios like 38.2%, 50%, and 61.8%, traders can forecast retracements, spot reversal zones, and set profit targets.

When combined with price action, Elliott Wave, and proper risk management, Fibonacci retracement turns from a simple math concept into a practical trading strategy. For deeper learning, structured programs such as the best trading course in Chennai provide the skills and confidence needed to trade like a professional.


identify support levels where retail traders are buying

7 Smart Ways to Identify Support Levels Where Retail Traders Are Buying

7 Smart Ways to Identify Support Levels

You are looking for to identify support levels where retail traders are buying, you need to look for repeated price floors, volume spikes, demand zones, moving averages, round numbers, and bullish candlestick patterns that signal strong buying interest. These support levels for trading act like a floor where falling prices pause and buyers step in, creating high-probability entry points for retail traders across stocks, forex, and crypto markets.    

identify support levels where retail traders are buying

Introduction

Every trader wants to know the secret: where are most people buying?
That’s where support levels come in.

Support is not just a line on a chart. It’s the place where demand quietly steps in and sellers start losing power. Retail traders—especially beginners—tend to buy at these levels because they believe prices will bounce back.

In this guide, you’ll learn 7 proven methods to identify support levels where retail traders are buying. Each method is explained in simple terms so even if you are new to trading, you’ll know exactly what to look for on your chart.


Why Support Levels Matter in Trading

Support levels are critical zones on a price chart. They represent the point where selling pressure reduces, and buying activity increases. For retail traders, identifying support levels is like finding a safety net in volatile markets. When you identify support levels where retail traders are buying, you discover price zones where the probability of a bounce is higher. This knowledge helps you make informed trading decisions and reduce losse


7 Smart Ways to Identify Support Levels Where Retail Traders Are Buying


1. Look for Repeated Price Floors  

identify support levels where retail traders are buying

One of the easiest ways to identify support levels where retail traders are buying is by studying past price history.The easiest way to spot support is by checking where prices bounce multiple times.

  • If a stock touches ₹100 three times and bounces each time, ₹100 is a strong support.
  • The more times the level holds, the stronger it becomes.

Why it works: Retail traders notice patterns. If they see prices holding at the same floor, they believe it’s “safe” to buy again.

Pro tip: Use a line chart (instead of candlesticks) to spot clean floors more easily.


2. Watch for Volume Spikes Near Lows  

identify support levels where retail traders are buying

Volume is a strong signal of buyer activity. When price approaches a support area and you see a volume spike, it’s a clue that retail traders are entering positions. To identify support levels where retail traders are buying with volume, look for high trading volume at previous lows.

Support is not just about price—it’s also about activity.
When prices hit a low and volume suddenly increases, it means buyers are stepping in.

Example: A stock falls to ₹250, volume doubles, and the price bounces. That spike tells you demand was strong at that price.

Why it works: Retail traders often buy when they see sudden rebounds with high volume.

How to use it:

  • Add a volume indicator below your chart.
  • Look for big green bars (buying volume) at or near the suspected support.

3. Use Moving Averages as Dynamic Support  

identify support levels where retail traders are buying

Demand zones are areas on a chart where heavy buying took place earlier. Professional traders and institutions often buy again in these zones, and retail traders follow. To identify support levels where retail traders are buying in demand zones, mark regions where prices moved sharply higher after consolidation

Support is not always a straight line—it can move with the market.
This is where moving averages help.

  • The 50-day moving average often acts as support for medium-term traders.
  • The 200-day moving average is a favorite for long-term investors.

When price falls to these averages, retail traders tend to buy, believing the stock is “cheap” compared to its average.

Pro tip: Check whether the moving average lines up with a horizontal support. If yes, the support is even stronger.


4. Spot Demand Zones on the Chart

identify support levels where retail traders are buying

Moving averages such as the 50-day or 200-day lines act as dynamic support. Many traders use them to guide their entries. To identify support levels where retail traders are buying with moving averages, watch for price pullbacks to these averages

A demand zone is a price range where large buying happened before. When price comes back to that zone, buyers often return.

For example:

  • If a stock rallies from ₹150 to ₹180 in a week, the zone between ₹150–₹155 may act as support later.

Why it works: Many retail traders mark these zones as “entry areas” and wait for prices to return.

How to use it:

  • Identify strong rallies in the past.
  • Mark the starting point of the rally—that’s your demand zone.

5. Pay Attention to Round Numbers  

identify support levels where retail traders are buying

Candlestick formations provide visual confirmation of support. Hammers, bullish engulfing patterns, and doji candles often appear near support areas. When you identify support levels where retail traders are buying with candlestick patterns, you add an extra layer of reliability.

Retail traders love round numbers: ₹50, ₹100, ₹1000.
Why? Because they’re easy to remember.

If a stock is falling, many buy orders are often placed at round numbers.
Example: If a stock is trading at ₹103, many buyers may place orders at ₹100.

Pro tip: Combine round numbers with volume or repeated price tests to confirm strong support.


6. Learn Bullish Candlestick Patterns  

identify support levels where retail traders are buying

Psychological levels like 100, 500, or 1000 often act as natural support points. Retail traders tend to place buy orders at these levels because they are easy to recognize. To identify support levels where retail traders are buying at round numbers, check if prices repeatedly pause or bounce around whole numbers.

Candlestick charts show the battle between buyers and sellers.
Certain patterns signal support is holding:

  • Hammer: A candle with a long lower wick shows buyers pushed price back up.
  • Bullish Engulfing: A strong green candle fully covers the previous red one.
  • Doji at Support: Signals indecision, often followed by a bounce.

Why it works: Retail traders often learn these patterns first and buy when they appear near support.

How to use it: Wait for the pattern to form at or near a known support zone.


7. Factor in Market Psychology   

identify support levels where retail traders are buying

Fibonacci retracements are another popular tool to find support. Traders often draw retracements at 38.2%, 50%, and 61.8% levels to forecast where price might bounce. To identify support levels where retail traders are buying with Fibonacci, watch how price reacts when it touches these retracement lines.

Support levels work because of trader psychology:

  • Fear of missing out (FOMO)
  • The belief that “history repeats”
  • Anchoring bias—traders think a stock “belongs” at certain prices

Retail traders pile in when they see confirmation of these beliefs.
If you learn to think like them, you can often spot where they’ll buy.

Pro tip: Combine psychology with technical tools like moving averages and volume.


How to Identify Support Levels Using Order Flow Data

One advanced way to identify support levels where retail traders are buying is by studying order flow data. Order flow shows where buy and sell orders are placed in the market. When you see a cluster of pending buy orders at the same price level, it often signals a strong support zone. Retail traders tend to place stop-limit or market buy orders in these areas, expecting a bounce. By combining order flow with traditional chart analysis, you can confirm which levels are more likely to attract real buying pressure.


Combining Technical Indicators to Identify Strong Support Levels

Another reliable method to identify support levels where retail traders are buying is by combining multiple technical indicators. For example, if a price floor aligns with a Fibonacci retracement level, a 50-day moving average, and a round number, the chance of retail traders stepping in increases significantly. When these signals overlap, retail traders see the zone as a high-probability entry point. This “confluence” of factors makes the support stronger and gives you higher confidence in your trades.


Putting It All Together

The best traders don’t rely on just one method. They combine techniques:

  • A repeated floor + high volume = strong support.
  • A round number + bullish candlestick = likely bounce.
  • A demand zone + moving average = powerful entry point.

By stacking these signals, you improve your accuracy and confidence.


FAQs (People Also Ask Style)

What is the simplest way to identify support levels?

Look for repeated price floors where the stock bounces several times. This is the easiest and most reliable method for beginners.

Do retail traders always buy at support?

Not always. Sometimes support breaks, especially in strong downtrends. Retail traders often buy at support, but professionals may wait for confirmation.

Is volume important when identifying support levels?

Yes. Rising volume at support shows real buying interest, making the level more reliable.

Can moving averages act as support?

Yes. Popular moving averages like the 50-day and 200-day often serve as dynamic support zones where traders buy.

How do you confirm if a support level is real?

Use multiple factors: repeated bounces, volume, candlestick patterns, and whether the level matches round numbers or demand zones.

Do support levels work in all markets?

Yes. Support levels are used in stocks, forex, crypto, and commodities. The psychology of buyers and sellers is universal.


Conclusion

Support levels are where markets pause, buyers step in, and sellers lose control. By learning 7 smart ways to identify support levels where retail traders are buying, you can improve your timing, reduce risk, and make more confident trades.

Trading is never about perfection—it’s about probability. The more signs you see at a support level, the higher your odds of success.

Start with the basics: repeated price floors and volume. Then add moving averages, candlestick patterns, and psychology. Over time, you’ll spot support levels almost instantly.Best to start with the trading classes and learn knowledge with us.

Get in Touch with us to get more knowledge about Trading .

Bear Harami Pattern

Bearish Harami – Japanese Candlestick Pattern

How to analysis and Trade with Bearish Harami Pattern

In this blog, we will see about the Bearish Harami Pattern, which is one of the Japanese candlestick charting techniques. We will deeply describe the Bearish Harami Pattern formation, structure, theory, and  techniques to analyze and make profit with this pattern.

You will learn more about the Bearish Harami Pattern in detail, which you could use in your trading technique. So read the full blog to get a better understanding of the pattern and techniques. Let’s dive into the concept.

Introduction of Bearish Harami Pattern

Bear Harami Pattern
Bear Harami Pattern

The Bearish Harami Pattern is a trend reversal pattern. It is formed on the Low Trend in the chart. So the prior trend should be a downtrend. If this pattern is formed in the High trend, it has the possibility that this pattern will work 80% in the market. 

Bearish Harami is a multiple candlestick pattern. It has two candlestick formations. The first candle is a bull candle and second is a bear candle. Now if you see in the above image, the first bull candle covers the second candle body fully. So it forms like a harami candle that shows us the market is going to reverse.

Bearish Harami Pattern

If you see in the above image, there is a Spinning Top formation at the low trend. So as per the single candlestick pattern theory of Spinning Top formation, the market is going to reverse. Then we also got confirmation that there is also a bear harami pattern is formed. Overall we have strong confirmation that the market will definitely move down.

Theory of Bearish Harami Pattern

Now we will be analyzing how the market will perform in this pattern. And how to analyze and take trade with this pattern.

Theory of Bearish Harami

As you see in the above image the Bearish Harami formed in the high trend. Then you can also see that there is a Shooting Star formation. Before these patterns were formed there was an uptrend. You can see that the market has full control over the buyers and reached the high price. Then the seller pushed the market for the reversal at the resistance level. This pattern should be formed in a higher timeframe. Then we can also analyze this pattern in the inner timeframe to check for structure formation. So we can take a Sell Entry in the next running candle.

Confirmation of Bearish Harami Pattern

If the next candle of the Bearish Harami breaks the previous support trend line, we can get confirmation that the market is going to fall. So we can take a sell entry to make a profit.

Confirmation for Bearish Harami

Entry for Bearish Harami Pattern

The Entry for the Bearish Harami Pattern will be between the running candle open price and the previous candle low price by analyzing in the inner timeframe to take entry in the sell range as shown in 1.

Entry for Bearish Harami

If the pattern is formed as shown in 2, you make an entry by analyzing the inner timeframe and entry at the resistance level.

Note: For taking entry you should always analyze the 15 min or lesser timeframe. You should take an entry on the cheapest price, so you can make a huge profit.

Stop Loss for Bearish Harami Pattern

Stop Loss for Bearish Harami

The Stop Loss for Bearish Harami Pattern will be the low price of the anyone of the Bearish Harami as shown above image.

Steps to check before taking the entry with this pattern.

Step 1: Search for the Bearish Harami pattern in the higher time frame. 

Step 2: Check if the pattern is in a high trend and the prior trend should be an uptrend.

Step 3: Check whether the bear harami is formed correctly. And you also check the 2nd candle that shows any single candlestick pattern.

Step 4: Check the structure formation if any in the inner timeframe of the pattern. If you get the perfect structure move on to the next step.

Step 5: Set entry and stop loss level as discussed in theory and execute the trade.

Step 6: Check for confirmation that the previous resistance line is broken, we also got confirmation that it is on a high trend, and the second candle also has a reversal pattern, so the market will surely move down and we can make a huge profit.

Bearish Harami Pattern Video Tutorial in English

How to Identify and Trade Trend Reversals in Stock Markets

Learn how to identify and trade the Bearish Harami Pattern, a powerful trend reversal signal in Japanese candlestick charting. In this tutorial, we’ll cover the formation, structure, and key strategies to profit from this pattern in stock market trading. Whether you’re a beginner or an experienced trader, this english language video will help you understand how to spot Bearish Harami, confirm its validity, and use it to make informed trading decisions. Don’t miss out on mastering this essential candlestick pattern to enhance your trading strategy!

பேரிஷ் ஹராமி பண்பாட்டு வீடியோ பயிற்சி

பங்குச் சந்தைகளில் போக்கு மாற்றங்களை கண்டறிந்து வர்த்தகம் செய்வது எப்படி

இந்த பேரிஷ் ஹராமி பண்பாட்டு வீடியோ பயிற்சியில், ஜப்பானிய கன்டிள்‌ஸ்டிக் சார்ட் தொழில்நுட்பத்தில் இந்த சக்திவாய்ந்த போக்கு மாற்றச் சிக்னலை எவ்வாறு கண்டறிந்து வர்த்தகம் செய்ய வேண்டும் என்பதை கற்றுக்கொள்ளவும். இந்த வீடியோவில், பேரிஷ் ஹராமி பண்பாட்டு உருவாக்கம், கட்டமைப்பு மற்றும் வர்த்தகத்தில் லாபம் அடைய முக்கியமான நெறிமுறைகள் பற்றிய முழுமையான விளக்கம் வழங்கப்படும். நீங்கள் ஆரம்பிக்கின்றவராக இருந்தாலும், அனுபவமுள்ள வர்த்தகராக இருந்தாலும், இந்த பயிற்சி உங்களுக்கு பேரிஷ் ஹராமி பண்பாட்டைப் புகார்ப்படுத்த, அதனை உறுதிப்படுத்த மற்றும் அறிவார்ந்த வர்த்தக முடிவுகளை எடுக்க உதவும். இந்த அடிப்படை கன்டிள்‌ஸ்டிக் பண்பாட்டை கற்றுக்கொண்டு உங்கள் வர்த்தகத் திட்டத்தை மேம்படுத்திக் கொள்ளுங்கள்!

Conclusion

In the overall analyze, this pattern shows us the possible reversal of the trend. For more in depth understanding and learning, you can contact classroom of traders to get more knowledge in stock market trading.

To know more, Click here…

Bullish Harami Pattern

Bullish Harami Candlestick Pattern

How to analysis and Trade with Bullish Harami Pattern

In this blog, we will see about the Bullish Harami Pattern, which is one of the Japanese candlestick charting techniques. We will deeply describe the Bullish Harami Pattern formation, structure, theory, and  techniques to analyze and make profit with this pattern.

You will learn more about the Bullish Harami Pattern in detail, which you could use in your trading technique. So read the full blog to get a better understanding of the pattern and techniques. Let’s dive into the concept.

Bull Harami Pattern
Bull Harami Pattern

The Bullish Harami Pattern is a trend reversal pattern. It is formed on the Low Trend in the chart. So the prior trend should be a downtrend. If this pattern is formed in the low trend, it has the possibility that this pattern will work 80% in the market. 

Bullish Harami is a multiple candlestick pattern. It has two candlestick formations. The first candle is a bear candle and second is a bull candle. Now if you see in above image, the first bear candle covers the second candle body fully. So it forms like a harami candle that shows us the market is going to reverse.

Bullish Harami Pattern

If you see in the above image, there is a Hammer Pattern formation at the low trend. So as per the single candlestick pattern theory of hammer formation, the market is going to reverse. Then we also got confirmation that there is also a bull harami pattern is formed. Overall we have strong confirmation that the market will definitely move up.

Theory of Bullish Harami Pattern

Now we will be analyzing how the market will perform in this pattern. And how to analyze and take trade with this pattern.

Theory of Bullish Harami

As you see in the above image the Bullish Harami formed in the low trend. Then you can also see that there is a Spinning Bottom formation. Before these patterns were formed there was a downtrend. You can see that the market has full control over the seller and reached the low price. Then the buyer pushed the market for the reversal at the support level. This pattern should be formed in a higher timeframe. Then we can also analyze this pattern in the inner timeframe to check for structure formation. So we can take a Buy Entry in the next running candle.

Confirmation of Bullish Harami Pattern

If the next candle of the Bullish Harami breaks the previous resistance trend line, we can get confirmation that the market is going to rise. So we can take a buy entry to make a profit.

Confirmation for Bullish Harami

Entry for Bullish Harami Pattern

The Entry for the Bullish Harami Pattern will be between the running candle open price and the previous candle low price by analyzing in the inner timeframe to take entry in the buy range as shown in 1.

Entry for Bullish Harami

If the pattern is formed as shown in 2, you make an entry by analyzing the inner timeframe and entry at the support level.

Note: For taking entry you should always analyze the 15 min or lesser timeframe. It shows how much cheaper you can buy or sell the script according to your analysis.

Stop Loss for Bullish Harami Pattern

Stop Loss for Bullish Harami

The Stop Loss for Bullish Harami Pattern will be the low price of the anyone of the Bullish Harami as shown above image.

Trailing Stop Loss for Bull Harami

You can also make a Trailing Stop Loss as the market goes above by drawing a support line as shown in the above image.

Steps to check before taking the entry with this pattern.

Step 1: Search for the Bullish Harami pattern in the higher time frame. 

Step 2: Check if the pattern is in a low trend and the prior trend should be a downtrend.

Step 3: Check whether the Bull Harami is formed correctly. And you also check the 2nd candle that shows any single candlestick pattern.

Step 4: Check the structure formation if any in the inner timeframe of the pattern. If you get the perfect structure move on to the next step.

Step 5: Set entry and stop loss level as discussed in theory and execute the trade.

Step 6: Check for confirmation that the previous resistance line is broken, we also got confirmation that this pattern is on a low trend, and the second candle also has a reversal pattern, so the market will surely move up and we can make a huge profit.

Spinning Bottom Pattern

Spinning Bottom Candlestick Pattern

Spinning Bottom Pattern: Definition, Theory, Methodology, and Trading Setup.

In this blog, we are going to see about the Spinning Bottom Pattern, which is one of the Japanese candlestick charting techniques. We will deeply describe the Spinning Bottom Pattern formation, structure, theory, and  techniques to analyze and make profit with this pattern.

You will learn more about the Spinning Bottom Pattern in detail, which you could use in your trading technique. So read the full blog to get a better understanding of the pattern and techniques. Let’s dive into the concept.

Introduction of Spinning Bottom Pattern

Spinning Bottom Pattern
Spinning Bottom

The Spinning Bottom Pattern is a trend reversal pattern. It is formed on the Low Trend in the chart. So the prior trend should be an downtrend. If this pattern is formed in the low trend, it has the possibility that this pattern will work 70% in the market.

Body and Shadow of the Spinning Bottom

The Spinning Bottom has a small real body and a long upper and lower shadow. The upper and lower shadow must be 1.5 times longer than the Spinning Bottom body. That is, if the body is 1 time the size means the upper and lower shadow must be 1.5 times longer or more than the size of the body. For the bearish candle, the open price will be lesser than the close price.

Body and Shadow of the Spinning Bottom

Structure of Spinning Bottom Pattern

Now let’s see how the Spinning Bottom Pattern structure should be formed. 

Structure 1 – OHLC

This structure tells about the presence of buyers and sellers in the pattern. On the open price, the buyer pushed the price high price and then the sellers took control of the market and pushed to the low price, and again the buyers came in pushed a little up and closed above the open price. This structure forms like a Spinning Bottom in the higher timeframe.

So if this structure is formed inside the Spinning Bottom in the inner timeframe, the pattern has a strong possibility that it will work 80% and will give a buy signal as the market moves up. We have to check this structure in the inner timeframe of the Spinning Bottom.

Spinning Top Pattern Structure 1

This Structure shows more buying strength and the pattern forms at the low trend. So the market will definitely move upside. Then if you draw a trend line in the inner timeframe, you can analyze that the structure of this pattern will hit the resistance and support of the trend. At that support at a low price there will be a reversal pattern at the inner timeframe that pushes the market upside. Overall the analysis shows that the market will definitely move upside.

Structure 2 – OLHC

This structure forms like on the open price, the sellers pushed the price to the low price and then the buyers pushed to the high price, and again the sellers came in pushed a little down and closed above the open price. This structure forms like a Spinning Bottom in the higher timeframe. So this structure gives less possibility that it will work in the market.

Spinning Top Pattern Structure 2

Note: We have to analyze the Spinning Bottom pattern in the higher timeframe. So you can check this pattern structure in the inner timeframe analysis. Spinning Bottom pattern will be formed in all the time frames. It is necessary to check the pattern in a higher timeframe to analyze more and it gives more accuracy to trade.

Theory of Spinning Bottom Pattern

Now we will be analyzing how the market will perform in this pattern. And how to analyze and take trade with this pattern.

Theory of Spinning Bottom

As you see in the above image the Spinning Bottom formed in the low trend. Before the pattern formed there was a downtrend. You can see that the market has full control over the seller and reached the low price. Then the seller came in and pushed the price down and again buyer pushed the price up and closed above the open price, thus forms like a Spinning Bottom. This pattern should be formed in a higher timeframe.

Then we can analyze this pattern in the inner timeframe to check for structure formation. If the structure is formed as we discussed above, we have a high possibility that this pattern will work in the market. So we can take a Buy Entry in the next running candle.

Confirmation of Spinning Bottom Pattern

If the next candle of the Spinning Bottom breaks the previous resistance trend line, we can get confirmation that the market is going to rise. So we can take a buy entry to make a profit.

Confirmation of Spinning Bottom

Entry for Spinning Bottom Pattern

The Entry for the Spinning Bottom Pattern will be between the running candle open price and the previous candle low price. You can analyze in the inner timeframe to take entry in the buy range as shown below the image.

Entry for Spinning Bottom

Stop Loss for Spinning Bottom Pattern

The Stop Loss for Spinning Bottom Pattern will be the low price of the Spinning Bottom as shown below image.

Stop Loss for Spinning Bottom

You can also make a Trailing Stop Loss as the market goes above by drawing a support line as shown in the above image.

Steps to check before taking the entry with this pattern.

Step 1: Search for the Spinning Bottom pattern in the higher time frame.

Step 2: Check if the pattern is in a low trend and the prior trend should be a downtrend.

Step 3: Check the Spinning Bottom structure –> it should be bearish –> the upper and lower shadow should be 1.5 times greater than the size of the body with perfect structure formation.

Step 4: Check the structure formation in the inner timeframe of the pattern. If you get the perfect structure move on to the next step.

Step 5: Set entry and stop loss level as discussed in theory and execute the trade.

Step 6: Check for confirmation that the previous resistance line is broken, we also got confirmation that it is on a low trend, and the structure formation of the Spinning Bottom is perfect so the market will surely move down and we can make a huge profit.

Spinning Bottom Candlestick Pattern in English

A Complete Trading Guide | Video Tutorial in English

Learn how to identify and trade the Spinning Bottom Candlestick Pattern in this comprehensive video tutorial in English. Understand the structure, theory, and significance of this pattern in technical analysis. Discover how Spinning Bottoms signal market indecision and potential trend reversals, and how you can use them to enhance your trading strategy. Watch now to unlock the secrets of profitable trading with Spinning Bottom candlesticks!

Spinning Bottom Candlestick Pattern in Tamil

A Complete Trading Guide | Video Tutorial in Tamil

Learn how to identify and trade the Spinning Bottom Candlestick Pattern in this comprehensive video tutorial in Tamil. Understand the structure, theory, and significance of this pattern in technical analysis. Discover how Spinning Bottoms signal market indecision and potential trend reversals, and how you can use them to enhance your trading strategy. Watch now to unlock the secrets of profitable trading with Spinning Bottom candlesticks!

Summary of “Spinning Bottom Pattern: Definition, Theory, Methodology, and Trading Setup”

In this blog, we explore the Spinning Bottom Pattern, a trend reversal pattern commonly used in Japanese candlestick charting. The Spinning Bottom pattern indicates market indecision and is typically formed during a downtrend. The pattern has a small real body with long upper and lower shadows, signaling a shift in market sentiment.

We discuss the structure of the Spinning Bottom Pattern, including the OHLC and OLHC structures, both of which suggest varying strengths of buyer and seller activity. The OHLC structure is particularly strong and signals a higher probability of an upward price movement, whereas the OLHC structure indicates a weaker possibility of success.

In this guide, we also dive into the theory behind the Spinning Bottom Pattern, how to confirm its formation, and the ideal entry and stop-loss strategies for profitable trading. A proper understanding of the pattern in a higher timeframe, followed by confirmation in an inner timeframe, can significantly improve trade accuracy.

The blog also covers steps to ensure a successful trade with the Spinning Bottom Pattern, emphasizing the importance of setting proper entry points, stop-loss levels, and confirming the breakout of resistance before executing a trade.

Additionally, the blog provides video tutorials in both English and Tamil, making it easier for traders from different regions to understand and apply the pattern in their trading strategies.

For more detailed information, including step-by-step analysis and a visual guide, you can refer to the full blog post and watch the tutorials linked below.

By following the guidelines and techniques presented in this blog, you can enhance your trading strategy and increase your chances of profitable trades using the Spinning Bottom pattern.

Spinning Top Pattern

Learn How to trade with Spinning Top Pattern

Perfect Spinning Top Pattern

In this blog, we are going to see about the Spinning Top Pattern, which is one of the Japanese candlestick charting techniques. We will deeply describe the Spinning Top Pattern formation, structure, theory, and techniques to analyze and make profit with this pattern.

You will learn more about the Spinning Top Pattern in detail, which you could use in your trading technique. So read the full blog to get a better understanding of the pattern and techniques. Let’s dive into the concept.

Introduction of Spinning Top Pattern

Spinning Top Pattern
Spinning Top

The Spinning Top Pattern is a trend reversal pattern. It is formed on the High Trend in the chart. So the prior trend should be an uptrend. If this pattern is formed in the high trend, it has the possibility that this pattern will work 70% in the market.

Body and Shadow of the Spinning Top

The Spinning Top has a small real body and a long upper and lower shadow. The upper and lower shadow must be 1.5 times longer than the Spinning Top body. That is, if the body is 1 time the size means the upper and lower shadow must be 1.5 times longer or more than the size of the body. For the bearish candle, the open price will be greater than the close price.

Open and Close for Spinning Top

Structure of Spinning Top Pattern

Now let’s see how the Spinning Top Pattern structure should be formed. 

Structure 1 – OLHC

This structure tells about the presence of buyers and sellers in the pattern. On the open price, the sellers pushed the price down to the low price and then the buyers took control of the market and pushed to the high price, and again the seller came in pushed a little down and closed below the open price. This structure forms like a Spinning Top in the higher timeframe.

So if this structure is formed inside the Spinning Top in the inner timeframe, the pattern has a strong possibility that it will work 80% and will give a sell signal as the market will move downside. We have to check this structure in the inner timeframe of the Spinning Top.

Spinning Top Pattern Structure 1

Structure 2 – OHLC

This structure forms like on the open price, the buyers pushed the price to the high price and then the sellers pushed to the low price, and again the buyers came in pushed a little up and closed below the open price. This structure forms like a Spinning Top in the higher timeframe. So this structure gives less possibility as that it will work in the market.

Spinning Top Structure 2

Note: We have to analyze the hanging man pattern in the higher timeframe. So you can check this pattern structure in the inner timeframe analysis. Hanging man pattern will be formed in all the time frames. It is necessary to check the pattern in a higher timeframe to analyze more and it gives more accuracy to trade.

Theory of Spinning Top Pattern

Now we will be analyzing how the market will perform in this pattern. And how to analyze and take trade with this pattern.

Theory of Spinning Top

As you see in the above image the Spinning Top formed in the high trend. Before the pattern formed there was an uptrend. You can see that the market has full control over the buyer and reached the high price. Then the seller came in and pushed the price down and again buyer pushed the price up and close below the open price, thus forms like a Spinning Top.

This pattern should be formed in a higher timeframe. Then we can analyze this pattern in the inner timeframe to check for structure formation. If the structure is formed as we discussed above, we have a high possibility that this pattern will work in the market. So we can take a Sell Entry in the next running candle.

Confirmation of Spinning Top Pattern

If the next candle of the Spinning Top breaks the previous support trend line, we can get confirmation that the market is going to fall. So we can short the market to make a profit.

The confirmation 1 shown in the below image, give a strong confirmation as the running candle broke and open below the support line. So it as high possibility and a strong confirmation that the market will definitely move downside.

Confirmation For Spinning Top

The confirmation 2 shown in the above image, give a low confirmation as the running candle open above the support line. Here in this confirmation also the market will bearish  because we have got a bearish pattern in the high trend that definitely push the market to downside. 

Note: It is just a confirmation that the market will move down in a different point of view

Entry for Spinning Top Pattern

The Entry for the Spinning Top Pattern will be between the running candle open price and the previous candle high price. You can analyze in the inner timeframe to take entry in the sell range as shown below the image.

Entry for Spinning Top

Then as shown above you can take sell entry, as the market will move downside according to our analysis.

Stop Loss for Spinning Top Pattern

The Stop Loss for Spinning Top Pattern will be the high price of the Spinning Top as shown below image in 1.

Stop Loss for Spinning Top

You can also keep extended stop loss as shown in above image in 2. This stop loss is strong and it has very less possibility to hit stop loss. In some cases the market has the possibility of reversal and hit the stop loss (1) and then move down. So it is most recommended to keep stop loss as shown in 2.

Trailing Stop Loss for Spinning Top

You can also make a Trailing Stop Loss as the market goes below by drawing a resistance line as shown in the above image.

Steps to check before taking the entry with this pattern.

Step 1: Search for the Spinning Top pattern in the higher time frame.

Step 2: Check if the pattern is in a high trend and the prior trend should be an uptrend.

Step 3: Check the Spinning Top structure –> it should be bearish –> the lower shadow should be 2 times or 3 times greater than the size of the body with perfect structure formation.

Step 4: Check the structure formation in the inner timeframe of the pattern. If you get the perfect structure move on to the next step.

Step 5: Set entry and stop loss level and execute the trade.

Step 6: Check for confirmation that the previous support line is broken, we also got confirmation that it is on a high trend, and the structure formation of the Spinning Top is perfect so the market will surely move down and we can make a huge profit.

Video Tutorials in Different Languages

Spinning Top Candlestick Pattern

A Complete Trading Guide | Video Tutorial in Tamil

Learn how to identify and trade the Spinning Top Candlestick Pattern in this comprehensive video tutorial in Tamil. Understand the structure, theory, and significance of this pattern in technical analysis. Discover how Spinning Tops signal market indecision and potential trend reversals, and how you can use them to enhance your trading strategy. Watch now to unlock the secrets of profitable trading with Spinning Top candlesticks!

Spinning Top Candlestick Pattern

A Complete Trading Guide | Video Tutorial in English

Learn how to identify and trade the Spinning Top Candlestick Pattern in this comprehensive video tutorial in English. Understand the structure, theory, and significance of this pattern in technical analysis. Discover how Spinning Tops signal market indecision and potential trend reversals, and how you can use them to enhance your trading strategy. Watch now to unlock the secrets of profitable trading with Spinning Top candlesticks

Summary of “Perfect Spinning Top Pattern”

In this blog, we delve into the Spinning Top Pattern, a popular trend reversal pattern in Japanese candlestick charting. The Spinning Top indicates market indecision, typically forming after an uptrend. It is characterized by a small real body and long upper and lower shadows, where the shadow length is at least 1.5 times the size of the body, signaling a shift in market sentiment.

We discuss the structure of the Spinning Top, focusing on two key formations:

  • Structure 1 (OLHC): This structure signals a bearish trend, with a high probability (80%) of the market moving downward.
  • Structure 2 (OHLC): This formation suggests a weaker probability of success, indicating less certainty in market movement.

The theory behind the Spinning Top highlights its formation after an uptrend, where sellers push prices down but buyers push back up, forming a small body. Confirmation of this pattern occurs when the next candle breaks below the support trend line, confirming a downward market movement.

Entry and Stop-Loss strategies for trading the Spinning Top involve:

  • Entering a sell position between the current candle’s open price and the previous candle’s high price.
  • Setting a stop-loss at the high price of the Spinning Top to protect against potential reversals.

Additionally, Trailing Stop-Loss can be used to lock in profits as the market moves in your favor.

The blog provides a step-by-step guide on identifying and trading the Spinning Top, including checking for the pattern in higher timeframes, confirming structure formation in inner timeframes, and setting appropriate entry and stop-loss levels.

Finally, the blog links to video tutorials in Tamil and English for a more comprehensive understanding of the Spinning Top Pattern and its practical application in trading strategies.

  • Spinning Top Candlestick Pattern in English – A Complete Trading Guide
  • Spinning Top Candlestick Pattern in Tamil – A Complete Trading Guide

By following the guidelines in this blog, traders can enhance their strategies and increase their chances of success when trading the Spinning Top Pattern.

Shooting Star Candlestick Pattern

What is Shooting Star Candlestick Pattern?

The Hidden Secret behind the Shooting Star Candlestick Pattern -Definition, Theory, Methodology, and Trading Setup.

In this blog, we are going to see about the Shooting Star Pattern, which is one of the Japanese candlestick charting techniques. We will deeply describe the Shooting Star Pattern formation, structure, theory, and techniques to analyze the pattern.

You will learn more about the Shooting Star Pattern in detail, which you could use in your trading technique. So read the full blog to get a better understanding of the pattern and techniques. Let’s dive into the concept.

Introduction of Shooting Star Pattern

Shooting Star Candlestick Pattern
Shooting Star

The Shooting Star Pattern is a trend reversal pattern. It is formed on the High Trend in the chart. So the prior trend should be an uptrend. If this pattern is formed in the high trend, it has the possibility that this pattern will work 70% in the market.

Long Upper Shadow Of Shooting Star
Long Upper Shadow Of Shooting Star.

It has a small real body and a long upper shadow. The body of the Shooting Star should be 3 times shorter than the upper shadow or the upper shadow must be 3 times longer than the Shooting Star body. That is, if the body is 1 time the size means the upper shadow must be 3 times longer than the size of the body. For the bearish candle, the open price will be greater than the close price.

Bearish Candle
Bearish Candle

Structure of Shooting Star Pattern

Now let’s see how the Shooting Star Pattern structure should be formed. We have different scenarios in which Shooting Star can be formed.

Different Structures of Shooting Star

The above image shows the different scenarios in which Shooting Star can be formed. We will see in detail about these patterns in the upcoming topics.

Why these 2 bullish shooting star is wrong

Bullish Shooting Star
Not a Shooting Star

These 2 bullish candles are not Shooting Star because there is buying pressure even though the seller pushed the market down. So this bullish shooting star has less probability that it will work in the market.

Why this bearish shooting star is wrong

Bearish Shooting Star

This bearish candle is not a Shooting Star pattern because the presence of the seller is low. It has the possibility that the buyer can push the market up fighting with the seller as the volume of the seller is low. As you can see, the upper shadow is only 2 times greater than the real body. The upper shadow should be more than the 3 times of the real body.

Why this bullish candle is a shooting star

Bullish Shooting Star

This bullish candle is considered a Shooting Star pattern, because as it has a bullish presence it also has a long upper shadow indicating that the seller pushed the market downside. So the market has a high probability that it will further move to the downside.

Why these 2 bearish candle is a shooting star

Bearish Shooting Star

Now these two bearish Shooting Star patterns are correct. The left side shooting star is the perfect shooting star. It forms bearish with a long upper shadow which is 3 times greater than the size of the body. It means the sellers had pushed the market downward and it will further move down due to the selling pressure.

The right side bearish candle is also a shooting star, but it is not recommended to trade with this shooting star. Because due to the very long upper shadow and the bearish body, the market already reached more selling pressure. So it has only below 50% possibility that this bearish shooting star will work in the market.

You can also check the candle formation in the inner timeframe to get strong confirmation as given in the below image.

Structure Formation of Shooting Star

If the OLHC structure is formed, it has a high probability that the pattern will work in the market. Because the formation has more selling pressure, so the market has more possibility to move downwards.

If the OHLC structure is formed, it has only 50% probability that the pattern will work in the market. Because the formation is indicating buying pressure at the close of the market.

Note: We have to analyze the Shooting Star pattern in the higher timeframe. So you can check this pattern structure in the inner timeframe analysis. Shooting Star pattern will be formed in all the time frames. It is necessary to check the pattern in a higher timeframe to analyze more and it gives more accuracy to trade.

Theory of Shooting Star Pattern

Now we will be analyzing how the market will perform in this pattern. And how to analyze and take trade with this pattern.

Theory of Shooting Star

As you see in the above image the Shooting Star formed in the high trend. Before the pattern formed there was an uptrend. You can see that the market has full control over the buyer and reached the high price. Then the seller came in and pushed the price down, thus forms like a shooting star. This pattern should be formed in a higher timeframe. Then we can analyze this pattern in the inner timeframe to check for structure formation. If the structure are formed as we discussed above, we have a high possibility that this pattern will work in the market. So we can take a Sell Entry in the next running candle.

Confirmation of Shooting Star Pattern

If the next candle of the Shooting Star breaks the previous support trend line, we can get confirmation that the market is going to fall. So we can short the market to make a profit.

Confirmation of Shooting Star

Entry for Shooting Star Pattern

The Entry for the Shooting Star Pattern will be between the running candle open price and the previous candle high price. You can analyze in the inner timeframe to take entry in the sell range as shown below the image.

Entry for Shooting Star Pattern
Entry for Shooting Star

Then as shown above you can take sell entry, as the market will move downside according to our analysis

Stop Loss for Shooting Star Pattern

The Stop Loss for Shooting Star Pattern will be the high price of the Shooting Star

Stop loss for Shooting Star Pattern
Stop loss for Shooting Star

You can also make a Trailing Stop Loss as the market goes below by drawing a resistance line as shown in the above image.

Steps to check before taking the entry with this pattern.

Step 1: Search for the Shooting Star pattern in the higher time frame.

Step 2: Check if the pattern is in a high trend and the prior trend should be an uptrend.

Step 3: Check the Shooting Star structure –> it should be bearish –> the Upper shadow should be 3 times greater than the size of the body with perfect structure formation.

Step 4: Check the structure formation in the inner timeframe of the pattern. If you get the perfect structure move on to the next step.

Step 5: Set entry and stop loss level and execute the trade.

Step 6: Check for confirmation that the previous support line is broken, we also got confirmation that it is on a high trend, and the structure formation of the Shooting Star is perfect so the market will surely move down and we can make a huge profit.

Shooting Star Candlestick Pattern Video Tutorials for Different languages

Shooting Star Candlestick Pattern – A Complete Trading Guide (English)

To get detailed information about the Shooting Star Pattern, Click and watch the video 👇

In this comprehensive video tutorial, learn how to identify and trade the Shooting Star Candlestick Pattern effectively. We’ll dive deep into its structure, theory, and significance in technical analysis, explaining how this pattern signals market indecision and potential trend reversals. Whether you’re a beginner or an experienced trader, this tutorial will help you incorporate the Shooting Star Pattern into your trading strategy to enhance your market predictions and make informed decisions. Watch now to understand how to spot this powerful pattern and use it to boost your trading success!

Shooting Star Candlestick Pattern – முழுமையான வர்த்தக வழிகாட்டி (தமிழில்)

இந்த முழுமையான வீடியோ教程இல், Shooting Star Candlestick Pattern ஐ எவ்வாறு கண்டறிந்து, அதை சரியாக வர்த்தகம் செய்யலாம் என்பதை நீங்கள் கற்றுக்கொள்ளப் போகின்றீர்கள். இந்த வரைபடம் எப்படி சந்தையின் மாற்றங்களை மற்றும் பின்விளைவுகளை குறிக்கின்றது என்பதை விளக்குகிறோம். இது நீங்கள் உங்கள் வர்த்தகத்தை மேம்படுத்த பயன்படுத்தக்கூடிய சக்திவாய்ந்த ஒரு முன்மாதிரியாக இருக்கும். இந்த வீடியோவை தற்போது பாருங்கள், இந்த உத்தரவாதமான முறையை கற்றுக்கொண்டு உங்கள் வர்த்தக வெற்றியை உயர்த்துங்கள்!

Conclusion

Finally for the shooting star pattern the target will be open. You can set according to your risk to reward ratio. The shooting star pattern will best work in the market with above explanation and trading methodology. So learn and practice more in the market to make profit with this pattern. If you want to learn with us, you can reach Classroom Of Traders.

Hanging Man Pattern

How To Analysis and Trade With Hanging Man Pattern

Advance Hanging man Pattern

In this blog, we are going to see about the Hanging Man Pattern, which is one of the Japanese candlestick charting techniques. We will deeply describe the Hanging Man Pattern formation, structure, theory, and techniques to analyze the pattern.

You will learn more about the Hanging Man Pattern in detail, which you could use in your trading technique. So read the full blog to get a better understanding of the pattern and techniques. Let’s dive into the concept.

Introduction of Hanging Man Pattern

Hanging Man
Hanging Man

The Hanging Man Pattern is a trend reversal pattern. It is formed on the High Trend in the chart. So the prior trend should be an uptrend. If this pattern is formed in the high trend, it has the possibility that this pattern will work 70% in the market.

Hanging Man
Hanging Man Pattern

Hanging Man has a small real body and a long lower shadow. The body of the hanging man should be 3 times shorter than the lower shadow or the lower shadow must be 3 times longer than the hanging man body. That is, if the body is 1 time the size means the lower shadow must be 3 times longer than the size of the body. For the bearish candle, the open price will be greater than the close price.

Hanging Man
Hanging Man Shadow

Note: If the candle of this pattern is in a bullish candle, it is not considered as a hanging man pattern. The reason for this will be explained in detail in the upcoming topic.

Structure of Hanging Man Pattern

Now we will see how the Hanging Man Pattern structure should be formed.

Structure 1 – OLHC

This structure tells about the presence of buyers and sellers in the pattern. On the open price, the sellers pushed the price down to the low price and then the buyers took control of the market and pushed to the high price, and again the seller came in pushed a little down and closed below the open price. This structure forms like a hanging man in the higher timeframe. So if this structure is formed inside the hanging man, the pattern has a strong possibility that it will work 80% and will give a sell signal as the market will move downside. We have to check this structure in the inner timeframe of the hanging man.

Structure 1
Structure 1

Structure 2 – OHLC

This structure forms like on the open price, the buyers pushed the price to the high price and then the sellers pushed to the low price, and again the buyers came in pushed a little up and closed below the open price. This structure forms like a hanging man in the higher timeframe. So this structure gives less possibility as that it will work in the market.

Structure 2
Structure 2

Note: We have to analyze the hanging man pattern in the higher timeframe. So you can check this pattern structure in the inner timeframe analysis. Hanging man pattern will be formed in all the time frames. It is necessary to check the pattern in a higher timeframe to analyze more and it gives more accuracy to trade.

Different scenarios in which Hanging Man can be formed.

Now we will be analyzing how the market will perform in this pattern. And how to analyze and take trade with this pattern.

Structure of Hanging Man Pattern

The above image shows the different scenarios in which hanging man can be formed. We will see in detail about these patterns in the upcoming topics.

Why these 3 Bullish Hanging Man are Wrong

Bullish Structure
Bullish Structure

These 3 bullish candles are not hanging man because there is more buying pressure in these candles. These candles are bullish and the buyers pushed the price to the high price. So these hanging man patterns have very little possibility that it will work in the market.

Why this long lower shadow Bearish hanging man is wrong

Bearish Structure
Bearish Structure

This bearish candle is considered as hanging man pattern, but it is not recommended to trade in this candle. Because in this candle the lower shadow is too long almost 4 times the real body. So the buying presence is more. If we trade in this candle the possibility is only 50% that the trade will be win or loss based on the structure that we discussed earlier.

Why this 2 hanging man are Correct

Bearish Structure
Bearish Hanging Man

Now these two bearish hanging man are perfectly formed. If these patterns are formed based on structure 1, then it has a high probability of getting the market reversed. Other than that if structure 2 is formed we can avoid that pattern as it gives less probability.

Theory of Hanging Man Pattern

Now we will be analyzing how the market will perform in this pattern. And how to analyze and take trade with this pattern.

Theory of Hanging Man

As you see in the above image the hanging man formed in the high trend. Before the pattern formed there was an uptrend. You can see that the market has full control over the buyer and reached the high price. Then the seller came in pushed the price down, but the buyers fought and pushed the price up and close below the open like a bearish candle.

This pattern should be formed in a higher timeframe. Then we can analyze this pattern in the inner timeframe to check for structure 1. If this pattern is like the formation of structure 1, we have a high possibility that this pattern will work in the market. So we can take a Sell Entry in the next running candle.

Confirmation of Hanging Man Pattern

If the next candle of the hanging man breaks the previous support trend line, we can get confirmation that the market is going to fall. So we can short the market to make a profit.

Hanging Man
Confirmation of Hanging Man

Entry for Hanging Man Pattern

The Entry for the Hanging Man Pattern will be above the running candle (that is above the next candle open price of hanging man). If the previous candle’s upper shadow is longer than the hanging man, you can take an entry as shown below in 1.

Hanging Man Entry
Entry for Hanging Man

Or If the previous candle’s upper shadow is shorter than the hanging man, you can take entry between the opening of the running candle and the previous candle high as in 2.

Then as shown above you can take sell entry, as the market will move downside according to our analysis.

Stop Loss for Hanging Man Pattern

The Stop Loss for Hanging Man Pattern will be the high price of the hanging man (2) or previous candle of the hanging man (1).

Hanging man stop loss
Stop Loss for Hanging Man

You can also make a Trailing Stop Loss (1) as the market goes below by drawing a resistance line as shown in the above image.

Steps to check before taking the entry with hanging man pattern.

Step 1: Search for the Hanging man pattern in the higher time frame.

Step 2: Check if the pattern is in a high trend and the prior trend should be an uptrend.

Step 3: Check the Hanging man structure –> it should be bearish –> the lower shadow should be 2 times or 3 times greater than the size of the body with perfect structure formation.

Step 4: Check the structure formation in the inner timeframe of the pattern. If you get the perfect structure move on to the next step.

Step 5: Set entry and stop loss level and execute the trade.

Step 6: Check for confirmation that the previous support line is broken, we also got the confirmation that it is on a high trend, and the structure formation of the hanging man both are perfect so the market will surely move down and we can make a huge profit.

Video Tutorials

Hanging Man Candlestick Pattern Explained in English | Learn Market Reversals

In this video, we dive deep into the Hanging Man Candlestick Pattern, a crucial tool in technical analysis for spotting potential market reversals. Learn how to identify this pattern, its underlying theory, and how it can help you predict bearish trends after an uptrend. We’ll walk you through the structure of the Hanging Man pattern, how to confirm its validity, and the best strategies for trading with it. Whether you’re a beginner or an experienced trader, this video will equip you with the knowledge to use the Hanging Man pattern effectively in your trading setup. Don’t miss out on this essential trading tool that can improve your market timing and decision-making.

ஹேங்கிங் மேன் கொண்டருக்குக் கட்டுப்பாடு வகை | சந்தை மறு திருப்பங்களை கற்றுக்கொள்ளவும்

இந்த வீடியோவில், நாங்கள் ஹேங்கிங் மேன் கொண்டருக்குக் கட்டுப்பாடு வகை குறித்து விரிவாக ஆராய்கிறோம், இது தொழில்நுட்ப பகுப்பாய்வில் சந்தை மறு திருப்பங்களை கண்டறிவதற்கான முக்கியமான கருவியாகும். இந்த வகையை எவ்வாறு அடையாளம் காண்பது, அதன் அடிப்படைத்தியரியம் மற்றும் அது எவ்வாறு பர்மான ஏற்றத்தைத் தொடர்ந்து பத்தல் பிரபலமான இடங்களை கணிக்க உதவுகிறது என்பதை கற்றுக்கொள்ளவும். ஹேங்கிங் மேன் கட்டுப்பாடு வகையின் அமைப்பை எவ்வாறு உறுதிப்படுத்துவது மற்றும் அதனை சரியான வர்த்தகத் திட்டங்களுடன் எவ்வாறு பயன்படுத்துவது என்று நாங்கள் எடுத்துக்காட்டி விளக்குவோம். நீங்கள் ஒரு புதிய பயனர் அல்லது அனுபவம் வாய்ந்த வர்த்தகர் எனப் பாராட்டாதீர்கள், இந்த வீடியோ உங்களுக்கு உங்கள் வர்த்தக பரிந்துரைகளில் இந்த முக்கியமான கொண்டருக்குக் கட்டுப்பாட்டை கையாள உதவும்.

1. What is the Hanging Man Candlestick Pattern?

The Hanging Man is a bearish reversal candlestick pattern that appears after an uptrend. It consists of a small real body near the top of the price range, with a long lower shadow. The pattern indicates that despite the price being driven higher during the session, the bears gained control, pushing the price back down, signaling a potential trend reversal to the downside.

2. How do you identify the Hanging Man Candlestick Pattern?

To identify a Hanging Man pattern:
It appears in an uptrend.
The candlestick has a small body (either bullish or bearish) located at the top of the price range.
It features a long lower shadow (at least twice the length of the body).
The upper shadow is very short or nonexistent.

3. What does the Hanging Man pattern indicate?

The Hanging Man indicates that after an uptrend, there is increasing selling pressure, and the market might be ready to reverse to a downtrend. The pattern shows that although buyers were initially in control, the sellers took over by the end of the session, signaling potential weakness in the prevailing uptrend.

4. Is the Hanging Man pattern always a sign of a market reversal?

No, the Hanging Man pattern does not always lead to a reversal. It must be confirmed by subsequent price action. For example, a bearish confirmation occurs if the next candlestick closes lower than the body of the Hanging Man. Without confirmation, the pattern may not be reliable.

5. How do you trade the Hanging Man Candlestick Pattern?

Entry: Enter a short (sell) position after the confirmation of the Hanging Man pattern. This confirmation can be a bearish candlestick closing below the Hanging Man’s body.
Stop-loss: Place a stop-loss just above the high of the Hanging Man candlestick to protect against false breakouts.
Target: Set a profit target based on support levels or other technical indicators such as the Relative Strength Index (RSI) or moving averages.

6. What are the differences between a Hanging Man and an Inverted Hammer?

Both patterns look similar, but the key difference is their location:
Hanging Man: Appears after an uptrend and signals a potential reversal to the downside.
Inverted Hammer: Appears after a downtrend and signals a potential reversal to the upside.

7. What are the key conditions for the Hanging Man pattern to be effective?

The pattern must form in a strong uptrend.
The longer the lower shadow, the stronger the signal.
Confirmation from the next candlestick or two is essential for increasing reliability.
A significant price reversal (not just a temporary pullback) should be expected after the pattern is confirmed.

8. Can the Hanging Man pattern be used in all timeframes?

Yes, the Hanging Man pattern can be used in all timeframes, but it is most reliable on higher timeframes (e.g., daily or weekly charts), as the patterns on smaller timeframes may lead to more false signals.

9. What are the limitations of the Hanging Man pattern?

It can generate false signals if not confirmed by the following candles.
It is not a guaranteed predictor of a trend reversal; market conditions and other indicators should be considered.
In isolation, the pattern may not be enough for a confident trade decision.

10. Is the Hanging Man pattern a good strategy for beginners?

While the Hanging Man pattern is an excellent tool, beginners should combine it with other technical indicators and risk management strategies. It is important to wait for confirmation and to practice proper stop-loss management to minimize potential losses.

How to Make a Perfect Entry and Exit with our Trading Signal

How to Make a Perfect Entry and Exit with our Trading Signal

How to Make a Perfect Entry and Exit with our Trading Signal, Inversion Tips, Swing Call, Risky Trade, Jackpot Call, Sure Shot Call

Inverted Hammer Candlestick Pattern

Perfect Theory for Profiting With Inverted Hammer Candlestick Pattern

A theory of the Inverted Hammer Candlestick pattern from the Classroom of Traders is presented here