Category: Trading

scalping trading stratergies

Scalping Trading Made Simple: Expert Strategies for Beginners

Scalping trading strategies are short-term trading methods that allow beginners to make multiple small profits in a single day. The fastest way to learn them is through a share market online class, where expert guidance, simple techniques, and risk management strategies help beginners trade efficiently and safely.


Introduction: Learn Scalping Trading Through a Share Market Online Class

Scalping trading strategies are short-term, high-speed trading methods that allow beginners to make multiple small profits in a single day, and the best way to learn them is through a share market online class. By following expert scalping methods and simple techniques, beginners can quickly understand entry and exit rules, manage risk, and develop the discipline needed to succeed in fast-paced markets.

A share market online class provides structured lessons on technical analysis, chart reading, trading psychology, and risk management. Instead of learning through trial and error, beginners gain access to expert scalping methods, live market examples, and practice exercises, which makes scalping trading for beginners much easier.


Why Scalping Trading Is Considered Difficult

Scalping is widely regarded as the most difficult trading style because it demands:

  • Ultra-fast decision making – Trades can last seconds to a few minutes.
  • High trade frequency – 20–100 trades per day are common.
  • Small profit margins – Each trade may yield only 0.1–0.5% profit.
  • High transaction costs – Commissions and spreads reduce gains.
  • Discipline and focus – Traders must control emotions and follow strict rules.

Beginners often feel overwhelmed, but a share market online class can simplify these concepts by teaching step-by-step scalping trading strategies.


Types of Scalping Trading Strategies

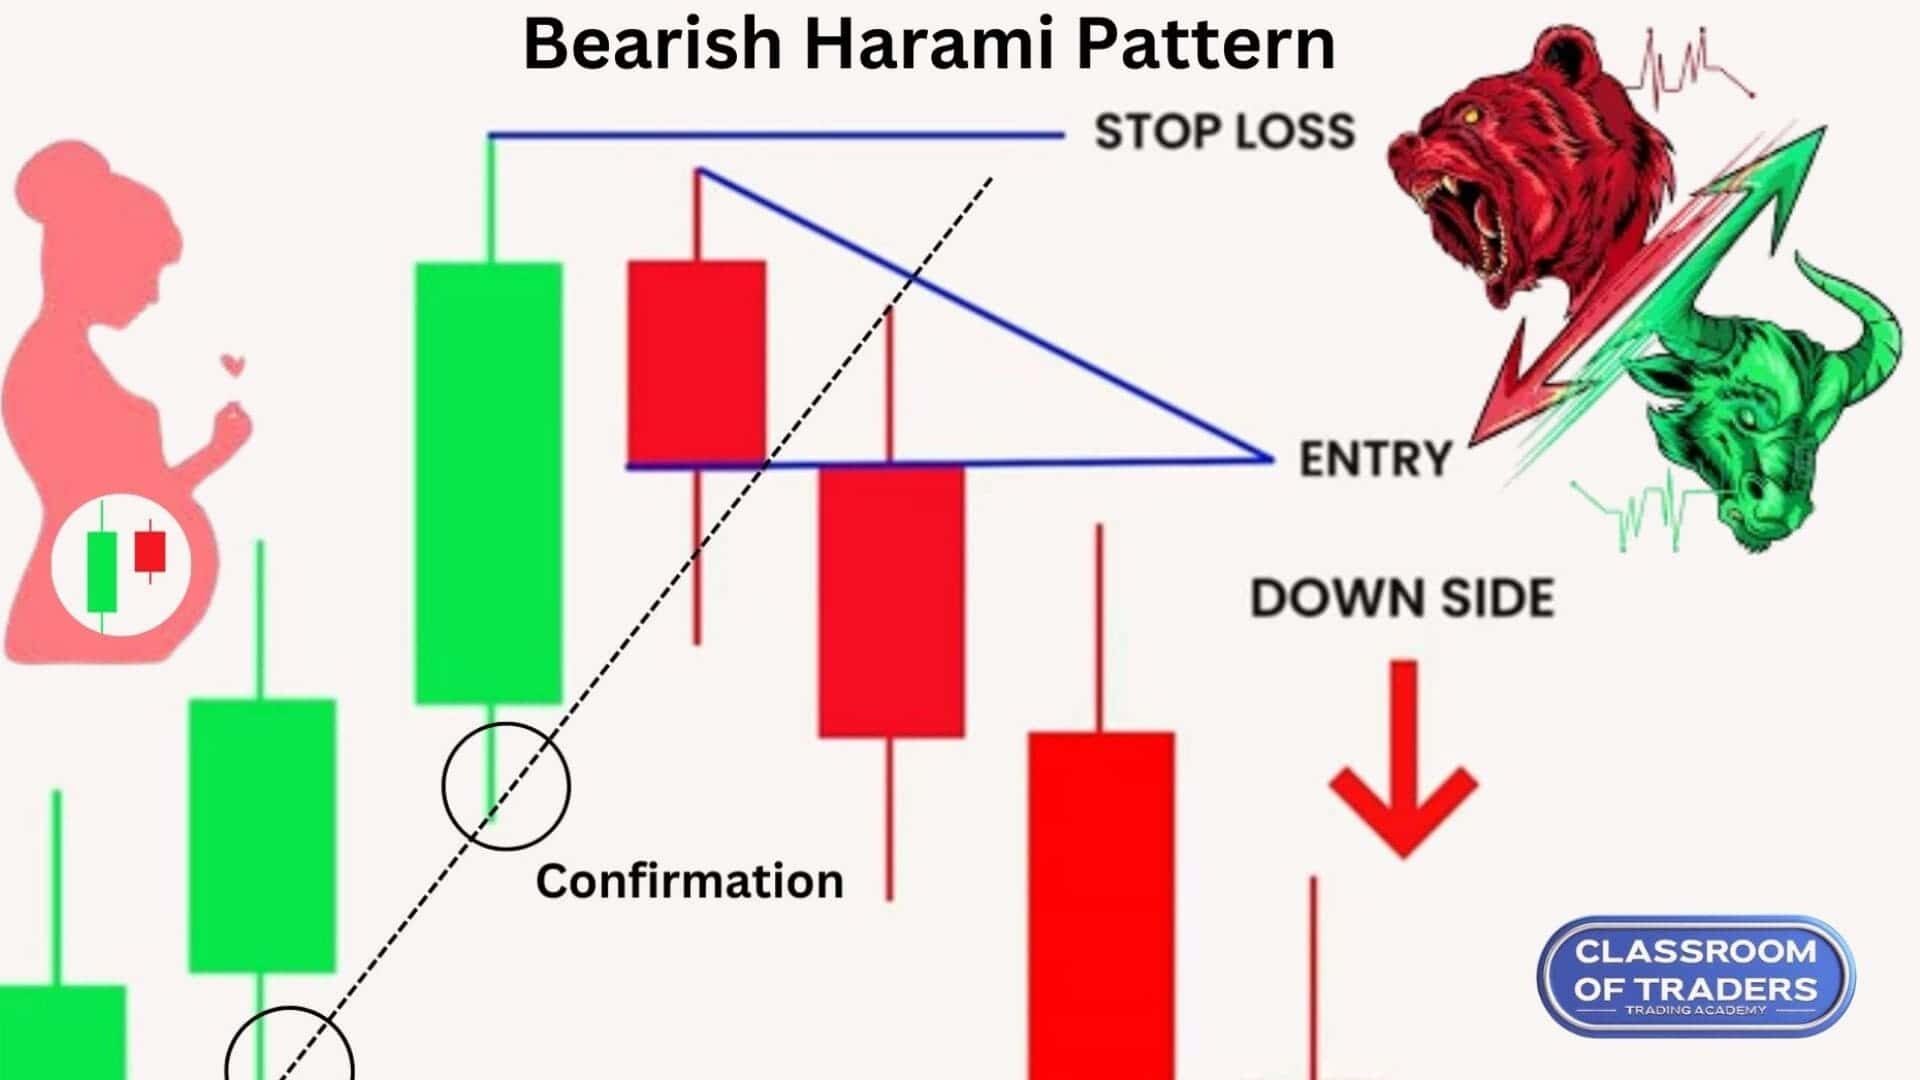
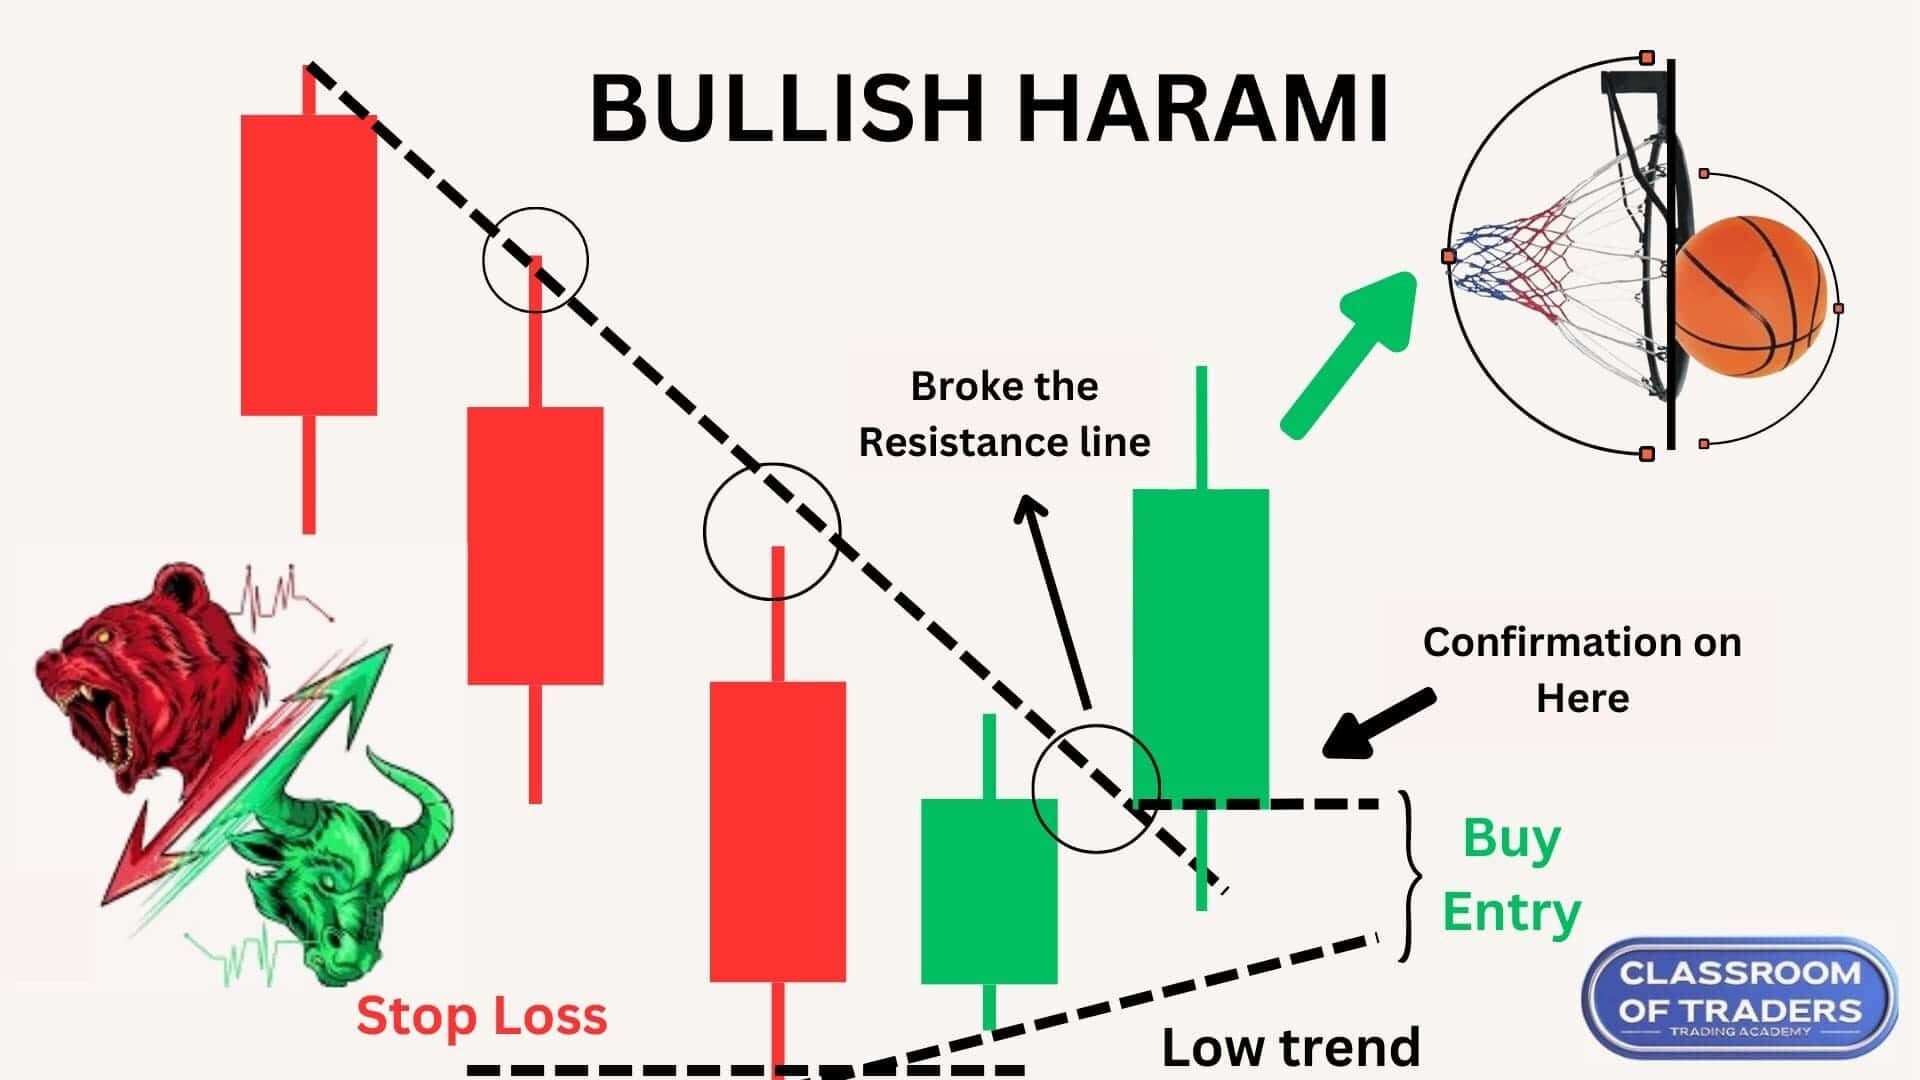
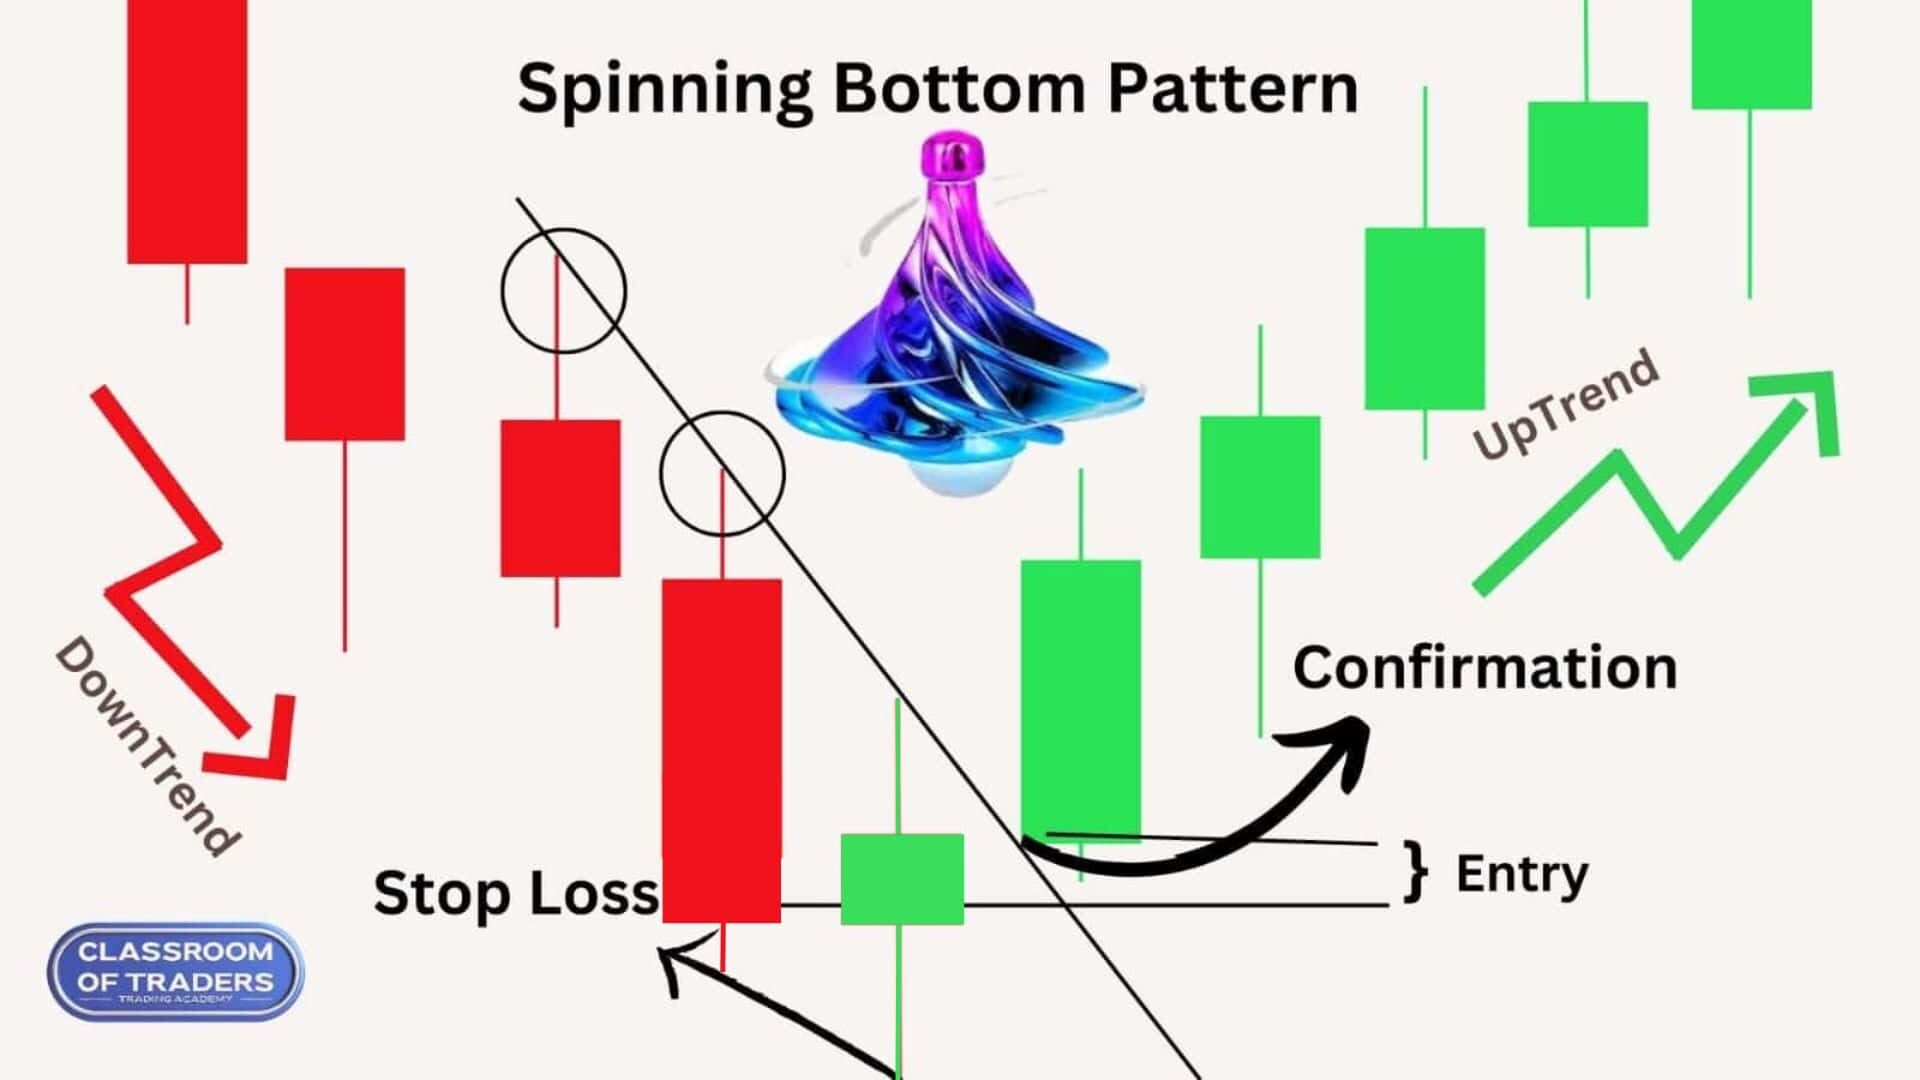
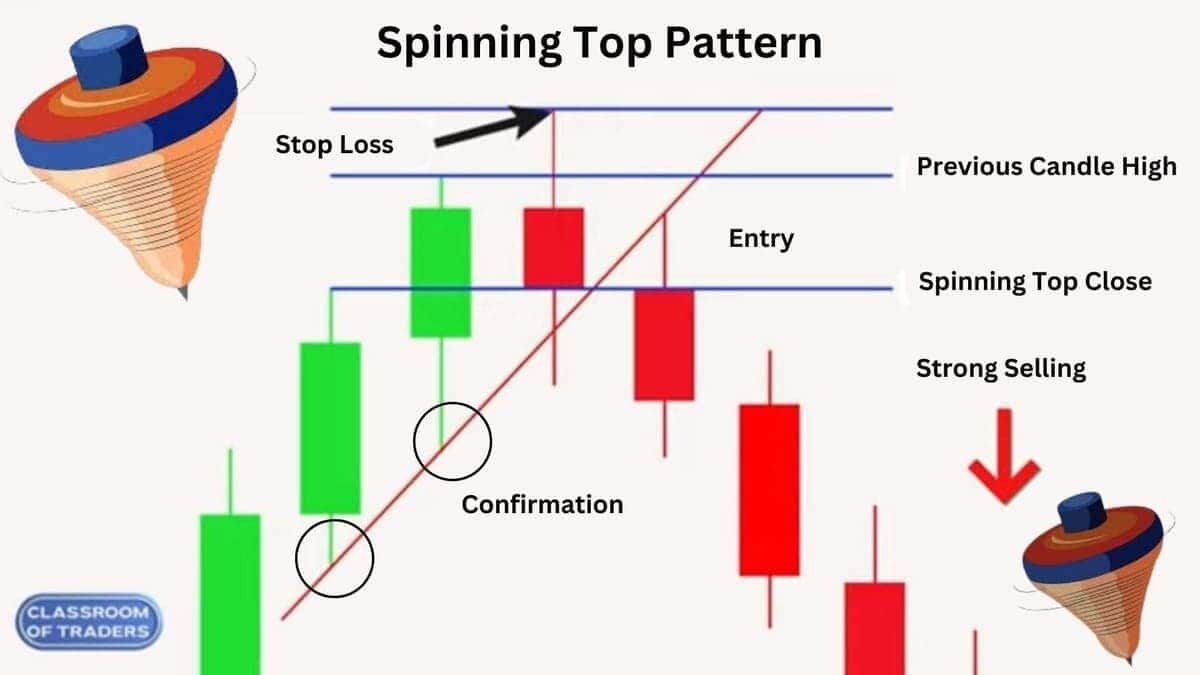
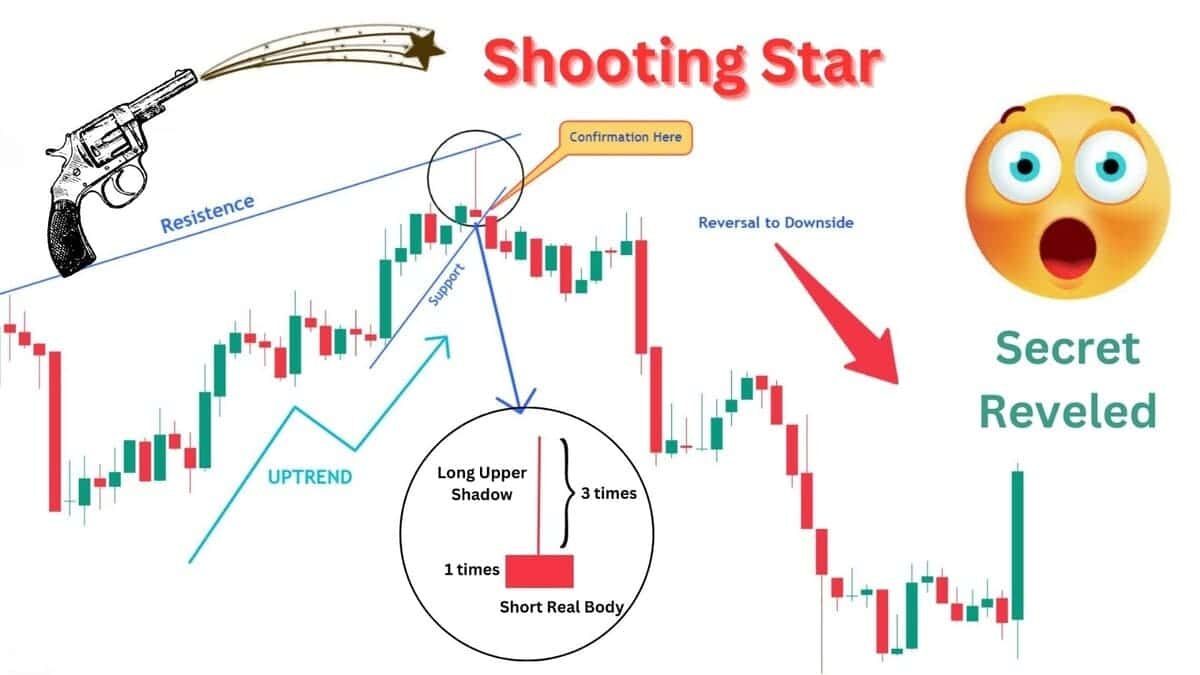
1. Price Action Scalping

scalping trading strategies
Price action scalping example using candlestick patterns
  • Focuses on candlestick patterns and support/resistance levels.
  • Example: If a stock price touches support at ₹1,000 and forms a bullish engulfing candle, a quick buy can be executed, targeting a 0.5–1% profit.
  • Ideal for beginners who prefer minimal indicators.

2. Moving Average Scalping

scalping trading strategies
Moving average crossover for scalping trading strategies
  • Uses short-term moving averages like 5-EMA and 20-EMA.
  • Example: If the 5-EMA crosses above the 20-EMA on a 5-minute chart, buy; sell when it reverses.
  • Works best in trending markets.

3. Momentum Scalping

scalping trading strategies
Momentum scalping strategy in action during market spikes
  • Based on sudden price spikes from news or events.
  • Example: A company announces quarterly results, and the stock jumps 2% in 10 minutes. Momentum scalpers buy immediately to capture small profits.
  • Requires experience and quick decision-making.

4. Range-Bound Scalping

scalping trading strategies
Range-bound scalping example between support and resistance.
  • Trades in sideways markets within support and resistance.
  • Example: Stock moves between ₹1,000 (support) and ₹1,020 (resistance). Buy near ₹1,000, sell near ₹1,020 repeatedly.
  • Requires patience and observation.

5. Indicator-Based Scalping

share market online class
Scalping trading using RSI and MACD indicators
  • Uses tools like RSI, MACD, and Stochastic Oscillator.
  • Example: Buy when RSI is oversold (<30) on a 1-minute chart; sell when RSI >70.
  • Provides beginners with clear entry and exit signals.

Step-by-Step Example of a Scalping Trade

Let’s go through a live trade setup for clarity:

  1. Asset Selection: Nifty 50 index
  2. Timeframe: 5-minute chart
  3. Indicator: RSI + 5-EMA / 20-EMA crossover
  4. Entry Rule: Buy when RSI <30 and 5-EMA crosses above 20-EMA
  5. Exit Rule: Sell when RSI >70 or when 5-EMA crosses below 20-EMA
  6. Stop-Loss: 0.2–0.5% below entry price
  7. Target Profit: 0.5–1% gain per trade

Result: In a 1-hour session, a trader could execute 5–8 such trades, accumulating 2–5% profit on their trading capital.


Mini Case Study: Beginner Success Story

Rohit, a beginner, joined a share market online class focused on scalping.

  • Week 1: Learned chart patterns and basic RSI setups.
  • Week 2: Practiced 10 demo trades per day.
  • Week 3: Executed live trades with ₹25,000 capital.
  • Outcome: Rohit made consistent small profits daily and avoided common mistakes like overtrading or ignoring stop-losses.

This shows the impact of structured learning and practice for beginners.


Expert Strategies to Make Scalping Simple

Use a Share Market Online Class

Classes offer step-by-step training, live sessions, and expert guidance. Beginners learn best scalping strategy, simple scalping techniques, and expert scalping methods in a structured environment.

Stick to the Right Timeframes

1-minute, 5-minute, and 15-minute charts are ideal. Avoid sub-minute charts—they are too noisy.

Set Entry and Exit Rules

Define stop-loss and target profit for each trade. Discipline prevents emotional mistakes.

Trade Liquid Markets

Focus on high-volume stocks, forex pairs, or commodities for fast execution and minimal slippage.

Use Low-Cost Brokers

High commissions destroy small profits. Use platforms like Zerodha Kite, Thinkorswim, and Interactive Brokers.

Practice Risk Management

Never risk more than 1–2% per trade. Small risks protect capital during losing streaks.

Control Emotions

Avoid revenge trading, take breaks, and maintain focus for consistent results.


Simple Scalping Techniques for Beginners

  • Trade one asset at a time
  • Follow a daily routine and trade checklist
  • Limit indicators to avoid confusion
  • Practice with demo accounts
  • Keep a trading journal to track mistakes and successes

Common Mistakes in Scalping Trading

  • Overtrading without a strategy
  • Ignoring transaction costs
  • Using too many indicators
  • Trading illiquid assets
  • Holding losses hoping for a reversal

Tools That Simplify Scalping Trading

share market online class
Essential trading platforms for scalping trading strategies.
  • Trading Platforms: Zerodha Kite, Thinkorswim, Interactive Brokers
  • Charting Tools: TradingView, MetaTrader 4/5
  • News Sources: Bloomberg, Reuters, Economic Calendars
  • Risk Calculators: For position sizing and managing losses

Risks and Rewards of Scalping

Rewards:

  • Quick profits
  • Multiple daily opportunities
  • Exciting, fast-paced trading environment

Risks:

  • High stress and mental fatigue
  • Small mistakes multiply quickly
  • High transaction costs
  • Requires strict discipline and patience

Supporting Paragraphs: Share Market Online Class

Why a Share Market Online Class Is Essential for Beginners

A share market online class provides structured learning for beginners who want to understand scalping trading strategies effectively. Unlike trial-and-error methods, these classes offer step-by-step guidance on technical analysis, chart reading, and risk management. By attending a share market online class, beginners gain access to expert scalping methods, live market examples, and practical exercises that help them build confidence before trading with real money.

Boost Your Scalping Skills with Expert-Led Share Market Online Classes

Expert-led share market online classes simplify complex trading strategies into actionable steps. Classes often cover best scalping strategy, simple scalping techniques, and managing multiple trades in high-pressure markets. Students also learn to use trading platforms, apply indicators like RSI or MACD, and execute trades efficiently. These classes equip beginners with the skills and discipline needed to succeed in scalping trading, making the learning curve much smoother.


FAQs

What is scalping trading for beginners?

Short-term strategy to make small profits using expert methods and risk management.

Can I learn scalping online?

Yes, share market online classes teach strategies, live examples, and risk management for beginners.

How much money do I need to start scalping?

₹25,000–₹50,000 for stocks, $500–$1000 for forex, depending on the market.

Which timeframe is best for scalping trading strategies?

1-minute, 5-minute, or 15-minute charts are ideal.

Is scalping profitable long term?

Yes, with strict rules, disciplined trading, and risk management.

What is the difference between scalping and day trading?

Scalping: many short trades for tiny profits.
Day trading: fewer trades held hours within the same day.

What is the best scalping strategy for beginners?

Price action, moving average crossovers, and indicator-based strategies like RSI or MACD.

How many trades should a beginner take in scalping?

Start with 5–10 trades per day to build experience safely.

Can scalping be automated with bots?

Yes, but beginners should learn manual trading first.

Which markets are best for scalping trading?

High-volume stocks, forex pairs, commodities, and liquid cryptocurrencies.

How do experts manage risk in scalping?

Stop-loss orders, small risk per trade, and avoiding overtrading.

How long does it take to learn scalping trading for beginners?

1–2 months to grasp basics; 6–12 months for mastery.

What indicators are commonly used in scalping trading strategies?

RSI, MACD, Stochastic Oscillator, Bollinger Bands, and moving averages.

How do I avoid losses in scalping trading?

Set stop-losses, limit risk, trade liquid assets, and control emotions.

Can scalping be done in stocks, forex, and crypto?

Yes, all liquid markets are suitable if proper strategies are applied.

What is range-bound scalping?

Using sudden price spikes caused by news or events to make quick profits.

What is momentum scalping?

Using sudden price spikes caused by news or events to make quick profits.

What is price action scalping?

Trading based on candlestick patterns and market movement without heavy indicators.

Are share market online classes enough to become a scalper?

They provide a foundation, but practical experience and disciplined practice are necessary.

How do moving averages help in scalping?

They identify short-term trends and provide clear buy/sell signals for quick trades.

educational routes for trading success

Best Educational Routes for Trading Success in 2025

Educational routes for trading success in 2025 include structured finance or economics degrees, specialized stock market training, online trading classes, and hands-on practice with simulators. These routes give aspiring traders the knowledge, discipline, and practical skills they need to succeed in today’s fast-moving markets, making them the most effective paths for building a long-term trading career.

best stock market training institute in chennai
A clear roadmap helps traders choose the right learning path

Why Education Matters in Trading

Trading is not just about buying low and selling high. It requires discipline, risk management, and a solid understanding of how markets move. Without the right education, traders often make emotional decisions that lead to losses. This is why structured educational routes for trading success are so important. They provide a roadmap for beginners and professionals to grow steadily, rather than relying on guesswork.


Top Educational Routes for Trading Success

1.Online Stock Market Courses

Online learning is one of the fastest-growing educational routes for trading success. Many global platforms and local providers offer classes on the online stock market, ranging from basics to advanced strategies. Online courses also include simulations, quizzes, and interactive sessions to test real-world knowledge.

2. Free Trading Classes and Resources

Free trading classes are valuable entry points for beginners who want to test the waters. Many institutes and online platforms provide introductory lessons covering candlestick charts, order types, and fundamental trading principles. While they may not be comprehensive, they provide a risk-free way to start learning.

3. Specialized Trading Institutes

Institutes focused on trading education provide targeted stock market lessons and structured paths for beginners. For example, the best stock market training institute in Chennai offers mentorship, live market practice, and industry-relevant training. Joining these institutes shortens the learning curve and provides direct exposure to real market scenarios.

4. Finance and Economics Degrees

trading classes in chennai
Different degrees open unique routes to trading success

Finance and economics degrees give traders a strong base in how money, markets, and investments work. These programs teach core subjects like market structures, portfolio management, and risk strategies. In 2025, traders who have academic training in these fields are better prepared to handle global volatility.

5. Mathematics and Statistics Programs

free trading class
Different degrees open unique routes to trading success.

Trading in modern markets is data-driven. Degrees in mathematics, statistics, or computer science help traders analyze large datasets, understand algorithms, and design systematic trading strategies. These skills are especially useful in algorithmic trading and quantitative analysis.

6. Business and Management Studies

Business degrees are another strong route. They cover organizational strategy, financial planning, and leadership skills—all of which help traders manage their capital like a business. Business schools also expose learners to case studies that sharpen decision-making.

7. Certifications and Professional Programs

educational routes for trading success
Different degrees open unique routes to trading success

Professional certifications such as CFA, CMT, FRM, or NISM provide credibility and advanced market insights. These certifications help traders specialize in risk management, technical analysis, or portfolio strategy, depending on their chosen career path.


The Importance of Structured Educational Routes for Trading Success

Structured learning plays a major role in shaping a trader’s career. While many people try to learn trading on their own, the most reliable educational routes for trading success come through guided programs that blend theory and practice. A structured path, such as degree courses in finance or targeted trading classes, helps traders understand risk management, technical analysis, and behavioral finance. These elements provide a strong foundation that separates consistent traders from those who rely only on luck.


Combining Online Resources and Classroom Training for Trading Success

One of the smartest educational routes for trading success is combining online resources with traditional classroom training. Online stock market lessons and share market online class give flexibility, while offline institutes offer real-time mentorship and peer interaction. This hybrid approach ensures that learners gain both theoretical depth and practical exposure. By balancing free trading classes, paid certifications, and live simulations, aspiring traders can build a step-by-step roadmap that maximizes their chances of success in the markets.


Practical Learning: The Real Key to Trading Success

Textbooks and lectures explain the “what” and “why” of trading, but practice shows the “how.” Practical education includes paper trading, stock market simulators, and demo accounts. These tools let traders make decisions, analyze mistakes, and refine strategies without risking real money. Successful traders always pair theory with practical experience.


Building a Long-Term Career Through Education

In 2025, trading is no longer a side hustle. Many professionals are making trading a full-time career. Educational routes like structured courses, online stock market training, and mentorship programs are helping them build sustainable success. Instead of chasing short-term profits, educated traders focus on consistency, risk control, and long-term financial independence.


FAQs on Educational Routes for Trading Success

1. What are the best educational routes for trading success in 2025?

The best routes include online stock market training, finance degrees, economics courses, technical analysis programs, and structured classes offered by reputed institutes. Combining formal education with practical trading lessons helps you succeed faster.

2. Do I need a degree to become a successful trader?

No, a degree is not mandatory. However, degrees in finance, economics, mathematics, or business can give you a strong foundation. Many successful traders rely on certifications, online stock market and hands-on practice instead.

3. Which degree helps most in stock trading?

A finance or economics degree helps the most because it covers market principles, investment strategies, and risk management. Math or statistics degrees are also valuable for algorithmic and quantitative trading.

4. Can I learn trading through free courses?

Yes. Many platforms and institutes offer free trading classes, stock trading lessons, and demo accounts. Free trading classes are excellent for beginners but should be paired with structured training for professional growth.

5. What are the benefits of taking trading classes in Chennai?

Trading classes in Chennai offer live mentorship, local market insights, and structured modules for beginners and professionals. Institutes like Classroom of Traders are considered among the best stock market training institutes in Chennai.

6. Is online stock market training effective?

Yes. Online stock market training is flexible, affordable, and interactive. It allows you to learn technical analysis, risk management, and live trading from anywhere while practicing on simulators.

7. How long does it take to learn trading?

On average, it takes 6–12 months to grasp the basics and 2–3 years to gain consistency. The learning curve depends on your study route—structured courses often shorten the journey.

8. Are stock trading lessons for beginners worth it?

Yes. Beginner-friendly stock trading lessons explain concepts in simple terms, help you avoid costly mistakes, and build confidence before you trade with real money.

9. What are the advantages of free trading classes?

Free trading classes let you test your interest in trading without spending money. They also introduce you to essential topics like candlestick patterns, order types, and portfolio management.

10. What skills should traders develop for long-term success?

Traders should focus on risk management, technical analysis, fundamental analysis, emotional control, and financial discipline. Continuous learning is also key to staying competitive.

11. Can I become a trader without joining an institute?

Yes, you can self-learn through books, videos, and practice accounts. However, joining a best stock market training institute speeds up learning and provides mentorship, which many self-learners miss.

12. What is the role of practical training in trading success?

Practical training is crucial because trading is skill-based. Paper trading, simulators, and live market mentorship allow you to apply theories and refine strategies without risking heavy losses.

13. Are online share market classes better than offline ones?

Both have advantages. Online classes provide flexibility and global access, while offline classes offer face-to-face mentorship and networking opportunities. Many traders combine both.

14. What certifications can help in trading careers?

Globally recognized certifications like CFA, CMT, FRM, or NISM (India) add credibility and deepen your technical knowledge, making you more employable or confident as an independent trader.

15. Do trading courses guarantee success?

No course can guarantee profits. What they guarantee is skill-building, risk awareness, and structured knowledge. Success depends on discipline, practice, and consistent execution

16. Why should I join a stock market training institute in Chennai?

Trading Institutes in Chennai offer tailored programs for Indian markets, bilingual learning, and mentorship from experienced traders. Many also provide placement assistance for finance-related jobs.

17. What’s the difference between stock trading lessons and investing courses?

Trading lessons focus on short-term price moves, technical charts, and quick strategies. Investing courses focus on long-term wealth building, company analysis, and value investing.

18. Can I start trading with just online courses?

Yes, online courses provide the knowledge you need to begin. However, it’s best to combine them with demo accounts, mentorship, and continuous practice.

19. Are there trading courses designed for absolute beginners?

Yes. Many institutes and platforms offer beginner-friendly stock trading lessons that start from scratch—covering market basics, how exchanges work, and simple strategies.

20. How do I choose the right trading class for me?

Check the institute’s reputation, trainer experience, syllabus quality, reviews, and whether they provide practical sessions. Always prioritize hands-on learning and mentorship.

best trading course in chennai

Fibonacci Retracement Strategy: Master Market Pullbacks

The Fibonacci retracement strategy is a trading method used to master market pullbacks by identifying support and resistance levels with key ratios like 38.2%, 50%, and 61.8%. Traders apply these levels to predict where prices may pause, reverse, or continue, making it easier to plan entries, exits, and profit targets across stocks, forex, and crypto markets. This simple yet powerful approach works best when combined with tools like price action, Elliott Wave Theory, and trend analysis.

Fibonacci retracement strategy


Introduction: Why Fibonacci Matters in Trading

Every trader faces the same question: when to enter and when to exit the market. Prices rarely move in straight lines—they rise, pull back, and then continue. The Fibonacci retracement strategy helps traders forecast these pullbacks with surprising accuracy.

Derived from the Fibonacci sequence and its golden ratio (61.8%), this method identifies areas where prices are likely to retrace before resuming their main trend. Whether you trade stocks, forex, or crypto, Fibonacci retracements provide a roadmap to navigate volatile markets.

best trading course in Chennai

Chapter 1: The Basics of Fibonacci in Trading

The Fibonacci sequence is a mathematical pattern (0, 1, 1, 2, 3, 5, 8, 13…) where each number is the sum of the two before it. From this sequence, traders use ratios like:

  • 23.6%
  • 38.2%
  • 50% (not Fibonacci but widely used)
  • 61.8% (Golden Ratio)
  • 78.6%

These ratios reveal likely support and resistance zones in price action.


Chapter 2: What Is a Fibonacci Retracement Strategy?

The Fibonacci retracement strategy is the practice of applying these ratios to forecast market behavior. It helps traders:

  • Identify pullback levels
  • Time entries and exits
  • Place stop-loss orders effectively
  • Forecast potential continuation or reversal points

Think of it as a map: If a stock climbs and then dips, Fibonacci shows where buyers may step back in.


Chapter 3: How to Use Fibonacci Retracement in Trading

Step 1: Identify a trend
Find a clear upward or downward trend.

Step 2: Apply the Fibonacci tool

  • In an uptrend → Draw from swing low to swing high
  • In a downtrend → Draw from swing high to swing low

Step 3: Watch the retracement levels

  • 38.2% → Shallow pullback
  • 50% → Moderate correction
  • 61.8% → Deep retracement, golden pocket

Step 4: Look for confirmation
Use candlestick signals, trendlines, or moving averages for confirmation before entering.


Chapter 4: Why Fibonacci Retracement Works

Fibonacci works because of market psychology:

  • Many traders watch the same levels
  • Institutions set orders near these ratios
  • Other trading systems, like Elliott Wave Theory, also rely on them

It’s less about magic and more about crowd behavior.


Chapter 5: Advanced Fibonacci Trading Techniques

Fibonacci Extensions

Used to project profit targets after retracements. Levels include 127.2%, 161.8%, and 261.8%.

Fibonacci Confluence

When Fibonacci levels overlap with support, resistance, or moving averages, the signal is stronger.

Harmonic Patterns

Patterns like Gartley, Bat, and Butterfly are built entirely on Fibonacci ratios, helping traders spot reversals.

Elliott Wave + Fibonacci

Wave structures often align with Fibonacci. For instance, Wave 2 often retraces 61.8%, and Wave 4 retraces 38.2%.


Chapter 6: Risk Management with Fibonacci

  • Always place stop-loss orders just beyond Fibonacci levels
  • Risk only 1–2% of account balance per trade
  • Combine Fibonacci with confirmation signals—never trade it alone

Chapter 7: Practical Examples

Example 1: Stock Market

Fibonacci retracement strategy

A stock rises from ₹100 to ₹200. Retracement to 61.8% (₹138) shows buyers stepping back in.

Example 2: Forex

Fibonacci retracement strategy

EUR/USD rallies from 1.0500 to 1.0800. It retraces to 50% (1.0650) and continues upward.

Example 3: Crypto

Fibonacci retracement strategy

Bitcoin climbs from $20,000 to $25,000. Retracement to $22,500 (50% level) becomes the launchpad for the next rally.


Chapter 8: Common Mistakes to Avoid

  1. Trading Fibonacci in a sideways market
  2. Expecting exact price reversals instead of zones
  3. Ignoring trend direction
  4. Overcomplicating charts with too many levels

Chapter 9: Learning Fibonacci the Right Way

Learn Fibonacci Retracement with the Best Trading Course in Chennai

Mastering Fibonacci requires more than theory. By joining the best trading course in Chennai, traders can practice applying retracement tools alongside candlestick patterns, Elliott Wave Theory, and price action trading. Courses provide real-market case studies, helping traders learn how retracements work across stocks, forex, and crypto.

Why the Best Trading Course in Chennai Enhances Your Skills

While self-learning works, structured mentorship accelerates progress. A best trading course in Chennai gives hands-on training, live market exposure, and personalized feedback. This helps traders avoid mistakes, apply Fibonacci confidently, and combine it with swing trading and intraday setups for consistent performance.


FAQs

1. What is the Fibonacci retracement strategy in trading?

The Fibonacci retracement strategy uses ratios like 38.2%, 50%, and 61.8% to spot support and resistance zones during pullbacks.

2. Why is Fibonacci retracement important in trading?

It helps traders forecast where corrections may end, allowing better entry and exit planning.

3. What are the most commonly used Fibonacci retracement levels?

23.6%, 38.2%, 50%, 61.8%, and 78.6%.

4. How do traders draw Fibonacci retracement levels?

In an uptrend, draw from swing low to swing high. In a downtrend, draw from swing high to swing low.

5. Can Fibonacci retracement be used in forex trading?

Yes, it’s widely used to identify pullbacks in currency pairs.

6. Is Fibonacci retracement useful for stock trading?

Absolutely—it helps identify dips in uptrends and profit-taking points in downtrends.

7. Does Fibonacci retracement work in crypto markets?

Yes, Bitcoin and other cryptos often respect Fibonacci zones.

8. What is the 61.8% Fibonacci level?

It’s the golden ratio—considered a strong reversal level.

9. Is the 50% retracement level a Fibonacci number?

No, but it’s used because markets often retrace about half a move.

10. How accurate is Fibonacci retracement strategy?

It’s not 100% accurate; best used with confirmation tools.

11. Can Fibonacci retracement predict exact price points?

No. It shows zones of interest, not exact numbers.

12. What’s the difference between Fibonacci retracement and extension?

Retracement shows pullbacks, extensions project targets.

13. How do I use Fibonacci retracement with Elliott Wave Theory?

Waves often align with Fibonacci—like Wave 2 retracing 61.8%.

14. What are Fibonacci confluence zones?

Areas where multiple Fibonacci levels overlap with other signals.

15. Can beginners use Fibonacci retracement strategy?

Yes, but practice with demo accounts is recommended first.

16. What are common mistakes with Fibonacci retracement?

Using it in sideways markets, ignoring trend, expecting precision.

17. Can Fibonacci retracement be used for intraday trading?

Yes, on smaller timeframes like 15-min or 1-hour charts.

18. How can I combine Fibonacci retracement with price action?

Look for candle patterns, breakouts, or retests near Fibonacci levels.

20. Where can I learn Fibonacci retracement strategy in depth?

Online resources are good, but structured programs like the best trading course in Chennai provide expert mentorship.

best trading course in Chenna

Conclusion

The Fibonacci retracement strategy is one of the most reliable tools for mastering market pullbacks. By using ratios like 38.2%, 50%, and 61.8%, traders can forecast retracements, spot reversal zones, and set profit targets.

When combined with price action, Elliott Wave, and proper risk management, Fibonacci retracement turns from a simple math concept into a practical trading strategy. For deeper learning, structured programs such as the best trading course in Chennai provide the skills and confidence needed to trade like a professional.


Bear Harami Pattern

Bearish Harami – Japanese Candlestick Pattern

How to analysis and Trade with Bearish Harami Pattern

In this blog, we will see about the Bearish Harami Pattern, which is one of the Japanese candlestick charting techniques. We will deeply describe the Bearish Harami Pattern formation, structure, theory, and  techniques to analyze and make profit with this pattern.

You will learn more about the Bearish Harami Pattern in detail, which you could use in your trading technique. So read the full blog to get a better understanding of the pattern and techniques. Let’s dive into the concept.

Introduction of Bearish Harami Pattern

Bear Harami Pattern
Bear Harami Pattern

The Bearish Harami Pattern is a trend reversal pattern. It is formed on the Low Trend in the chart. So the prior trend should be a downtrend. If this pattern is formed in the High trend, it has the possibility that this pattern will work 80% in the market. 

Bearish Harami is a multiple candlestick pattern. It has two candlestick formations. The first candle is a bull candle and second is a bear candle. Now if you see in the above image, the first bull candle covers the second candle body fully. So it forms like a harami candle that shows us the market is going to reverse.

Bearish Harami Pattern

If you see in the above image, there is a Spinning Top formation at the low trend. So as per the single candlestick pattern theory of Spinning Top formation, the market is going to reverse. Then we also got confirmation that there is also a bear harami pattern is formed. Overall we have strong confirmation that the market will definitely move down.

Theory of Bearish Harami Pattern

Now we will be analyzing how the market will perform in this pattern. And how to analyze and take trade with this pattern.

Theory of Bearish Harami

As you see in the above image the Bearish Harami formed in the high trend. Then you can also see that there is a Shooting Star formation. Before these patterns were formed there was an uptrend. You can see that the market has full control over the buyers and reached the high price. Then the seller pushed the market for the reversal at the resistance level. This pattern should be formed in a higher timeframe. Then we can also analyze this pattern in the inner timeframe to check for structure formation. So we can take a Sell Entry in the next running candle.

Confirmation of Bearish Harami Pattern

If the next candle of the Bearish Harami breaks the previous support trend line, we can get confirmation that the market is going to fall. So we can take a sell entry to make a profit.

Confirmation for Bearish Harami

Entry for Bearish Harami Pattern

The Entry for the Bearish Harami Pattern will be between the running candle open price and the previous candle low price by analyzing in the inner timeframe to take entry in the sell range as shown in 1.

Entry for Bearish Harami

If the pattern is formed as shown in 2, you make an entry by analyzing the inner timeframe and entry at the resistance level.

Note: For taking entry you should always analyze the 15 min or lesser timeframe. You should take an entry on the cheapest price, so you can make a huge profit.

Stop Loss for Bearish Harami Pattern

Stop Loss for Bearish Harami

The Stop Loss for Bearish Harami Pattern will be the low price of the anyone of the Bearish Harami as shown above image.

Steps to check before taking the entry with this pattern.

Step 1: Search for the Bearish Harami pattern in the higher time frame. 

Step 2: Check if the pattern is in a high trend and the prior trend should be an uptrend.

Step 3: Check whether the bear harami is formed correctly. And you also check the 2nd candle that shows any single candlestick pattern.

Step 4: Check the structure formation if any in the inner timeframe of the pattern. If you get the perfect structure move on to the next step.

Step 5: Set entry and stop loss level as discussed in theory and execute the trade.

Step 6: Check for confirmation that the previous resistance line is broken, we also got confirmation that it is on a high trend, and the second candle also has a reversal pattern, so the market will surely move down and we can make a huge profit.

Bearish Harami Pattern Video Tutorial in English

How to Identify and Trade Trend Reversals in Stock Markets

Learn how to identify and trade the Bearish Harami Pattern, a powerful trend reversal signal in Japanese candlestick charting. In this tutorial, we’ll cover the formation, structure, and key strategies to profit from this pattern in stock market trading. Whether you’re a beginner or an experienced trader, this english language video will help you understand how to spot Bearish Harami, confirm its validity, and use it to make informed trading decisions. Don’t miss out on mastering this essential candlestick pattern to enhance your trading strategy!

பேரிஷ் ஹராமி பண்பாட்டு வீடியோ பயிற்சி

பங்குச் சந்தைகளில் போக்கு மாற்றங்களை கண்டறிந்து வர்த்தகம் செய்வது எப்படி

இந்த பேரிஷ் ஹராமி பண்பாட்டு வீடியோ பயிற்சியில், ஜப்பானிய கன்டிள்‌ஸ்டிக் சார்ட் தொழில்நுட்பத்தில் இந்த சக்திவாய்ந்த போக்கு மாற்றச் சிக்னலை எவ்வாறு கண்டறிந்து வர்த்தகம் செய்ய வேண்டும் என்பதை கற்றுக்கொள்ளவும். இந்த வீடியோவில், பேரிஷ் ஹராமி பண்பாட்டு உருவாக்கம், கட்டமைப்பு மற்றும் வர்த்தகத்தில் லாபம் அடைய முக்கியமான நெறிமுறைகள் பற்றிய முழுமையான விளக்கம் வழங்கப்படும். நீங்கள் ஆரம்பிக்கின்றவராக இருந்தாலும், அனுபவமுள்ள வர்த்தகராக இருந்தாலும், இந்த பயிற்சி உங்களுக்கு பேரிஷ் ஹராமி பண்பாட்டைப் புகார்ப்படுத்த, அதனை உறுதிப்படுத்த மற்றும் அறிவார்ந்த வர்த்தக முடிவுகளை எடுக்க உதவும். இந்த அடிப்படை கன்டிள்‌ஸ்டிக் பண்பாட்டை கற்றுக்கொண்டு உங்கள் வர்த்தகத் திட்டத்தை மேம்படுத்திக் கொள்ளுங்கள்!

Conclusion

In the overall analyze, this pattern shows us the possible reversal of the trend. For more in depth understanding and learning, you can contact classroom of traders to get more knowledge in stock market trading.

To know more, Click here…

Bullish Harami Pattern

Bullish Harami Candlestick Pattern

How to analysis and Trade with Bullish Harami Pattern

In this blog, we will see about the Bullish Harami Pattern, which is one of the Japanese candlestick charting techniques. We will deeply describe the Bullish Harami Pattern formation, structure, theory, and  techniques to analyze and make profit with this pattern.

You will learn more about the Bullish Harami Pattern in detail, which you could use in your trading technique. So read the full blog to get a better understanding of the pattern and techniques. Let’s dive into the concept.

Bull Harami Pattern
Bull Harami Pattern

The Bullish Harami Pattern is a trend reversal pattern. It is formed on the Low Trend in the chart. So the prior trend should be a downtrend. If this pattern is formed in the low trend, it has the possibility that this pattern will work 80% in the market. 

Bullish Harami is a multiple candlestick pattern. It has two candlestick formations. The first candle is a bear candle and second is a bull candle. Now if you see in above image, the first bear candle covers the second candle body fully. So it forms like a harami candle that shows us the market is going to reverse.

Bullish Harami Pattern

If you see in the above image, there is a Hammer Pattern formation at the low trend. So as per the single candlestick pattern theory of hammer formation, the market is going to reverse. Then we also got confirmation that there is also a bull harami pattern is formed. Overall we have strong confirmation that the market will definitely move up.

Theory of Bullish Harami Pattern

Now we will be analyzing how the market will perform in this pattern. And how to analyze and take trade with this pattern.

Theory of Bullish Harami

As you see in the above image the Bullish Harami formed in the low trend. Then you can also see that there is a Spinning Bottom formation. Before these patterns were formed there was a downtrend. You can see that the market has full control over the seller and reached the low price. Then the buyer pushed the market for the reversal at the support level. This pattern should be formed in a higher timeframe. Then we can also analyze this pattern in the inner timeframe to check for structure formation. So we can take a Buy Entry in the next running candle.

Confirmation of Bullish Harami Pattern

If the next candle of the Bullish Harami breaks the previous resistance trend line, we can get confirmation that the market is going to rise. So we can take a buy entry to make a profit.

Confirmation for Bullish Harami

Entry for Bullish Harami Pattern

The Entry for the Bullish Harami Pattern will be between the running candle open price and the previous candle low price by analyzing in the inner timeframe to take entry in the buy range as shown in 1.

Entry for Bullish Harami

If the pattern is formed as shown in 2, you make an entry by analyzing the inner timeframe and entry at the support level.

Note: For taking entry you should always analyze the 15 min or lesser timeframe. It shows how much cheaper you can buy or sell the script according to your analysis.

Stop Loss for Bullish Harami Pattern

Stop Loss for Bullish Harami

The Stop Loss for Bullish Harami Pattern will be the low price of the anyone of the Bullish Harami as shown above image.

Trailing Stop Loss for Bull Harami

You can also make a Trailing Stop Loss as the market goes above by drawing a support line as shown in the above image.

Steps to check before taking the entry with this pattern.

Step 1: Search for the Bullish Harami pattern in the higher time frame. 

Step 2: Check if the pattern is in a low trend and the prior trend should be a downtrend.

Step 3: Check whether the Bull Harami is formed correctly. And you also check the 2nd candle that shows any single candlestick pattern.

Step 4: Check the structure formation if any in the inner timeframe of the pattern. If you get the perfect structure move on to the next step.

Step 5: Set entry and stop loss level as discussed in theory and execute the trade.

Step 6: Check for confirmation that the previous resistance line is broken, we also got confirmation that this pattern is on a low trend, and the second candle also has a reversal pattern, so the market will surely move up and we can make a huge profit.

Spinning Bottom Pattern

Spinning Bottom Candlestick Pattern

Spinning Bottom Pattern: Definition, Theory, Methodology, and Trading Setup.

In this blog, we are going to see about the Spinning Bottom Pattern, which is one of the Japanese candlestick charting techniques. We will deeply describe the Spinning Bottom Pattern formation, structure, theory, and  techniques to analyze and make profit with this pattern.

You will learn more about the Spinning Bottom Pattern in detail, which you could use in your trading technique. So read the full blog to get a better understanding of the pattern and techniques. Let’s dive into the concept.

Introduction of Spinning Bottom Pattern

Spinning Bottom Pattern
Spinning Bottom

The Spinning Bottom Pattern is a trend reversal pattern. It is formed on the Low Trend in the chart. So the prior trend should be an downtrend. If this pattern is formed in the low trend, it has the possibility that this pattern will work 70% in the market.

Body and Shadow of the Spinning Bottom

The Spinning Bottom has a small real body and a long upper and lower shadow. The upper and lower shadow must be 1.5 times longer than the Spinning Bottom body. That is, if the body is 1 time the size means the upper and lower shadow must be 1.5 times longer or more than the size of the body. For the bearish candle, the open price will be lesser than the close price.

Body and Shadow of the Spinning Bottom

Structure of Spinning Bottom Pattern

Now let’s see how the Spinning Bottom Pattern structure should be formed. 

Structure 1 – OHLC

This structure tells about the presence of buyers and sellers in the pattern. On the open price, the buyer pushed the price high price and then the sellers took control of the market and pushed to the low price, and again the buyers came in pushed a little up and closed above the open price. This structure forms like a Spinning Bottom in the higher timeframe.

So if this structure is formed inside the Spinning Bottom in the inner timeframe, the pattern has a strong possibility that it will work 80% and will give a buy signal as the market moves up. We have to check this structure in the inner timeframe of the Spinning Bottom.

Spinning Top Pattern Structure 1

This Structure shows more buying strength and the pattern forms at the low trend. So the market will definitely move upside. Then if you draw a trend line in the inner timeframe, you can analyze that the structure of this pattern will hit the resistance and support of the trend. At that support at a low price there will be a reversal pattern at the inner timeframe that pushes the market upside. Overall the analysis shows that the market will definitely move upside.

Structure 2 – OLHC

This structure forms like on the open price, the sellers pushed the price to the low price and then the buyers pushed to the high price, and again the sellers came in pushed a little down and closed above the open price. This structure forms like a Spinning Bottom in the higher timeframe. So this structure gives less possibility that it will work in the market.

Spinning Top Pattern Structure 2

Note: We have to analyze the Spinning Bottom pattern in the higher timeframe. So you can check this pattern structure in the inner timeframe analysis. Spinning Bottom pattern will be formed in all the time frames. It is necessary to check the pattern in a higher timeframe to analyze more and it gives more accuracy to trade.

Theory of Spinning Bottom Pattern

Now we will be analyzing how the market will perform in this pattern. And how to analyze and take trade with this pattern.

Theory of Spinning Bottom

As you see in the above image the Spinning Bottom formed in the low trend. Before the pattern formed there was a downtrend. You can see that the market has full control over the seller and reached the low price. Then the seller came in and pushed the price down and again buyer pushed the price up and closed above the open price, thus forms like a Spinning Bottom. This pattern should be formed in a higher timeframe.

Then we can analyze this pattern in the inner timeframe to check for structure formation. If the structure is formed as we discussed above, we have a high possibility that this pattern will work in the market. So we can take a Buy Entry in the next running candle.

Confirmation of Spinning Bottom Pattern

If the next candle of the Spinning Bottom breaks the previous resistance trend line, we can get confirmation that the market is going to rise. So we can take a buy entry to make a profit.

Confirmation of Spinning Bottom

Entry for Spinning Bottom Pattern

The Entry for the Spinning Bottom Pattern will be between the running candle open price and the previous candle low price. You can analyze in the inner timeframe to take entry in the buy range as shown below the image.

Entry for Spinning Bottom

Stop Loss for Spinning Bottom Pattern

The Stop Loss for Spinning Bottom Pattern will be the low price of the Spinning Bottom as shown below image.

Stop Loss for Spinning Bottom

You can also make a Trailing Stop Loss as the market goes above by drawing a support line as shown in the above image.

Steps to check before taking the entry with this pattern.

Step 1: Search for the Spinning Bottom pattern in the higher time frame.

Step 2: Check if the pattern is in a low trend and the prior trend should be a downtrend.

Step 3: Check the Spinning Bottom structure –> it should be bearish –> the upper and lower shadow should be 1.5 times greater than the size of the body with perfect structure formation.

Step 4: Check the structure formation in the inner timeframe of the pattern. If you get the perfect structure move on to the next step.

Step 5: Set entry and stop loss level as discussed in theory and execute the trade.

Step 6: Check for confirmation that the previous resistance line is broken, we also got confirmation that it is on a low trend, and the structure formation of the Spinning Bottom is perfect so the market will surely move down and we can make a huge profit.

Spinning Bottom Candlestick Pattern in English

A Complete Trading Guide | Video Tutorial in English

Learn how to identify and trade the Spinning Bottom Candlestick Pattern in this comprehensive video tutorial in English. Understand the structure, theory, and significance of this pattern in technical analysis. Discover how Spinning Bottoms signal market indecision and potential trend reversals, and how you can use them to enhance your trading strategy. Watch now to unlock the secrets of profitable trading with Spinning Bottom candlesticks!

Spinning Bottom Candlestick Pattern in Tamil

A Complete Trading Guide | Video Tutorial in Tamil

Learn how to identify and trade the Spinning Bottom Candlestick Pattern in this comprehensive video tutorial in Tamil. Understand the structure, theory, and significance of this pattern in technical analysis. Discover how Spinning Bottoms signal market indecision and potential trend reversals, and how you can use them to enhance your trading strategy. Watch now to unlock the secrets of profitable trading with Spinning Bottom candlesticks!

Summary of “Spinning Bottom Pattern: Definition, Theory, Methodology, and Trading Setup”

In this blog, we explore the Spinning Bottom Pattern, a trend reversal pattern commonly used in Japanese candlestick charting. The Spinning Bottom pattern indicates market indecision and is typically formed during a downtrend. The pattern has a small real body with long upper and lower shadows, signaling a shift in market sentiment.

We discuss the structure of the Spinning Bottom Pattern, including the OHLC and OLHC structures, both of which suggest varying strengths of buyer and seller activity. The OHLC structure is particularly strong and signals a higher probability of an upward price movement, whereas the OLHC structure indicates a weaker possibility of success.

In this guide, we also dive into the theory behind the Spinning Bottom Pattern, how to confirm its formation, and the ideal entry and stop-loss strategies for profitable trading. A proper understanding of the pattern in a higher timeframe, followed by confirmation in an inner timeframe, can significantly improve trade accuracy.

The blog also covers steps to ensure a successful trade with the Spinning Bottom Pattern, emphasizing the importance of setting proper entry points, stop-loss levels, and confirming the breakout of resistance before executing a trade.

Additionally, the blog provides video tutorials in both English and Tamil, making it easier for traders from different regions to understand and apply the pattern in their trading strategies.

For more detailed information, including step-by-step analysis and a visual guide, you can refer to the full blog post and watch the tutorials linked below.

By following the guidelines and techniques presented in this blog, you can enhance your trading strategy and increase your chances of profitable trades using the Spinning Bottom pattern.

Spinning Top Pattern

Learn How to trade with Spinning Top Pattern

Perfect Spinning Top Pattern

In this blog, we are going to see about the Spinning Top Pattern, which is one of the Japanese candlestick charting techniques. We will deeply describe the Spinning Top Pattern formation, structure, theory, and techniques to analyze and make profit with this pattern.

You will learn more about the Spinning Top Pattern in detail, which you could use in your trading technique. So read the full blog to get a better understanding of the pattern and techniques. Let’s dive into the concept.

Introduction of Spinning Top Pattern

Spinning Top Pattern
Spinning Top

The Spinning Top Pattern is a trend reversal pattern. It is formed on the High Trend in the chart. So the prior trend should be an uptrend. If this pattern is formed in the high trend, it has the possibility that this pattern will work 70% in the market.

Body and Shadow of the Spinning Top

The Spinning Top has a small real body and a long upper and lower shadow. The upper and lower shadow must be 1.5 times longer than the Spinning Top body. That is, if the body is 1 time the size means the upper and lower shadow must be 1.5 times longer or more than the size of the body. For the bearish candle, the open price will be greater than the close price.

Open and Close for Spinning Top

Structure of Spinning Top Pattern

Now let’s see how the Spinning Top Pattern structure should be formed. 

Structure 1 – OLHC

This structure tells about the presence of buyers and sellers in the pattern. On the open price, the sellers pushed the price down to the low price and then the buyers took control of the market and pushed to the high price, and again the seller came in pushed a little down and closed below the open price. This structure forms like a Spinning Top in the higher timeframe.

So if this structure is formed inside the Spinning Top in the inner timeframe, the pattern has a strong possibility that it will work 80% and will give a sell signal as the market will move downside. We have to check this structure in the inner timeframe of the Spinning Top.

Spinning Top Pattern Structure 1

Structure 2 – OHLC

This structure forms like on the open price, the buyers pushed the price to the high price and then the sellers pushed to the low price, and again the buyers came in pushed a little up and closed below the open price. This structure forms like a Spinning Top in the higher timeframe. So this structure gives less possibility as that it will work in the market.

Spinning Top Structure 2

Note: We have to analyze the hanging man pattern in the higher timeframe. So you can check this pattern structure in the inner timeframe analysis. Hanging man pattern will be formed in all the time frames. It is necessary to check the pattern in a higher timeframe to analyze more and it gives more accuracy to trade.

Theory of Spinning Top Pattern

Now we will be analyzing how the market will perform in this pattern. And how to analyze and take trade with this pattern.

Theory of Spinning Top

As you see in the above image the Spinning Top formed in the high trend. Before the pattern formed there was an uptrend. You can see that the market has full control over the buyer and reached the high price. Then the seller came in and pushed the price down and again buyer pushed the price up and close below the open price, thus forms like a Spinning Top.

This pattern should be formed in a higher timeframe. Then we can analyze this pattern in the inner timeframe to check for structure formation. If the structure is formed as we discussed above, we have a high possibility that this pattern will work in the market. So we can take a Sell Entry in the next running candle.

Confirmation of Spinning Top Pattern

If the next candle of the Spinning Top breaks the previous support trend line, we can get confirmation that the market is going to fall. So we can short the market to make a profit.

The confirmation 1 shown in the below image, give a strong confirmation as the running candle broke and open below the support line. So it as high possibility and a strong confirmation that the market will definitely move downside.

Confirmation For Spinning Top

The confirmation 2 shown in the above image, give a low confirmation as the running candle open above the support line. Here in this confirmation also the market will bearish  because we have got a bearish pattern in the high trend that definitely push the market to downside. 

Note: It is just a confirmation that the market will move down in a different point of view

Entry for Spinning Top Pattern

The Entry for the Spinning Top Pattern will be between the running candle open price and the previous candle high price. You can analyze in the inner timeframe to take entry in the sell range as shown below the image.

Entry for Spinning Top

Then as shown above you can take sell entry, as the market will move downside according to our analysis.

Stop Loss for Spinning Top Pattern

The Stop Loss for Spinning Top Pattern will be the high price of the Spinning Top as shown below image in 1.

Stop Loss for Spinning Top

You can also keep extended stop loss as shown in above image in 2. This stop loss is strong and it has very less possibility to hit stop loss. In some cases the market has the possibility of reversal and hit the stop loss (1) and then move down. So it is most recommended to keep stop loss as shown in 2.

Trailing Stop Loss for Spinning Top

You can also make a Trailing Stop Loss as the market goes below by drawing a resistance line as shown in the above image.

Steps to check before taking the entry with this pattern.

Step 1: Search for the Spinning Top pattern in the higher time frame.

Step 2: Check if the pattern is in a high trend and the prior trend should be an uptrend.

Step 3: Check the Spinning Top structure –> it should be bearish –> the lower shadow should be 2 times or 3 times greater than the size of the body with perfect structure formation.

Step 4: Check the structure formation in the inner timeframe of the pattern. If you get the perfect structure move on to the next step.

Step 5: Set entry and stop loss level and execute the trade.

Step 6: Check for confirmation that the previous support line is broken, we also got confirmation that it is on a high trend, and the structure formation of the Spinning Top is perfect so the market will surely move down and we can make a huge profit.

Video Tutorials in Different Languages

Spinning Top Candlestick Pattern

A Complete Trading Guide | Video Tutorial in Tamil

Learn how to identify and trade the Spinning Top Candlestick Pattern in this comprehensive video tutorial in Tamil. Understand the structure, theory, and significance of this pattern in technical analysis. Discover how Spinning Tops signal market indecision and potential trend reversals, and how you can use them to enhance your trading strategy. Watch now to unlock the secrets of profitable trading with Spinning Top candlesticks!

Spinning Top Candlestick Pattern

A Complete Trading Guide | Video Tutorial in English

Learn how to identify and trade the Spinning Top Candlestick Pattern in this comprehensive video tutorial in English. Understand the structure, theory, and significance of this pattern in technical analysis. Discover how Spinning Tops signal market indecision and potential trend reversals, and how you can use them to enhance your trading strategy. Watch now to unlock the secrets of profitable trading with Spinning Top candlesticks

Summary of “Perfect Spinning Top Pattern”

In this blog, we delve into the Spinning Top Pattern, a popular trend reversal pattern in Japanese candlestick charting. The Spinning Top indicates market indecision, typically forming after an uptrend. It is characterized by a small real body and long upper and lower shadows, where the shadow length is at least 1.5 times the size of the body, signaling a shift in market sentiment.

We discuss the structure of the Spinning Top, focusing on two key formations:

  • Structure 1 (OLHC): This structure signals a bearish trend, with a high probability (80%) of the market moving downward.
  • Structure 2 (OHLC): This formation suggests a weaker probability of success, indicating less certainty in market movement.

The theory behind the Spinning Top highlights its formation after an uptrend, where sellers push prices down but buyers push back up, forming a small body. Confirmation of this pattern occurs when the next candle breaks below the support trend line, confirming a downward market movement.

Entry and Stop-Loss strategies for trading the Spinning Top involve:

  • Entering a sell position between the current candle’s open price and the previous candle’s high price.
  • Setting a stop-loss at the high price of the Spinning Top to protect against potential reversals.

Additionally, Trailing Stop-Loss can be used to lock in profits as the market moves in your favor.

The blog provides a step-by-step guide on identifying and trading the Spinning Top, including checking for the pattern in higher timeframes, confirming structure formation in inner timeframes, and setting appropriate entry and stop-loss levels.

Finally, the blog links to video tutorials in Tamil and English for a more comprehensive understanding of the Spinning Top Pattern and its practical application in trading strategies.

  • Spinning Top Candlestick Pattern in English – A Complete Trading Guide
  • Spinning Top Candlestick Pattern in Tamil – A Complete Trading Guide

By following the guidelines in this blog, traders can enhance their strategies and increase their chances of success when trading the Spinning Top Pattern.

Shooting Star Candlestick Pattern

What is Shooting Star Candlestick Pattern?

The Hidden Secret behind the Shooting Star Candlestick Pattern -Definition, Theory, Methodology, and Trading Setup.

In this blog, we are going to see about the Shooting Star Pattern, which is one of the Japanese candlestick charting techniques. We will deeply describe the Shooting Star Pattern formation, structure, theory, and techniques to analyze the pattern.

You will learn more about the Shooting Star Pattern in detail, which you could use in your trading technique. So read the full blog to get a better understanding of the pattern and techniques. Let’s dive into the concept.

Introduction of Shooting Star Pattern

Shooting Star Candlestick Pattern
Shooting Star

The Shooting Star Pattern is a trend reversal pattern. It is formed on the High Trend in the chart. So the prior trend should be an uptrend. If this pattern is formed in the high trend, it has the possibility that this pattern will work 70% in the market.

Long Upper Shadow Of Shooting Star
Long Upper Shadow Of Shooting Star.

It has a small real body and a long upper shadow. The body of the Shooting Star should be 3 times shorter than the upper shadow or the upper shadow must be 3 times longer than the Shooting Star body. That is, if the body is 1 time the size means the upper shadow must be 3 times longer than the size of the body. For the bearish candle, the open price will be greater than the close price.

Bearish Candle
Bearish Candle

Structure of Shooting Star Pattern

Now let’s see how the Shooting Star Pattern structure should be formed. We have different scenarios in which Shooting Star can be formed.

Different Structures of Shooting Star

The above image shows the different scenarios in which Shooting Star can be formed. We will see in detail about these patterns in the upcoming topics.

Why these 2 bullish shooting star is wrong

Bullish Shooting Star
Not a Shooting Star

These 2 bullish candles are not Shooting Star because there is buying pressure even though the seller pushed the market down. So this bullish shooting star has less probability that it will work in the market.

Why this bearish shooting star is wrong

Bearish Shooting Star

This bearish candle is not a Shooting Star pattern because the presence of the seller is low. It has the possibility that the buyer can push the market up fighting with the seller as the volume of the seller is low. As you can see, the upper shadow is only 2 times greater than the real body. The upper shadow should be more than the 3 times of the real body.

Why this bullish candle is a shooting star

Bullish Shooting Star

This bullish candle is considered a Shooting Star pattern, because as it has a bullish presence it also has a long upper shadow indicating that the seller pushed the market downside. So the market has a high probability that it will further move to the downside.

Why these 2 bearish candle is a shooting star

Bearish Shooting Star

Now these two bearish Shooting Star patterns are correct. The left side shooting star is the perfect shooting star. It forms bearish with a long upper shadow which is 3 times greater than the size of the body. It means the sellers had pushed the market downward and it will further move down due to the selling pressure.

The right side bearish candle is also a shooting star, but it is not recommended to trade with this shooting star. Because due to the very long upper shadow and the bearish body, the market already reached more selling pressure. So it has only below 50% possibility that this bearish shooting star will work in the market.

You can also check the candle formation in the inner timeframe to get strong confirmation as given in the below image.

Structure Formation of Shooting Star

If the OLHC structure is formed, it has a high probability that the pattern will work in the market. Because the formation has more selling pressure, so the market has more possibility to move downwards.

If the OHLC structure is formed, it has only 50% probability that the pattern will work in the market. Because the formation is indicating buying pressure at the close of the market.

Note: We have to analyze the Shooting Star pattern in the higher timeframe. So you can check this pattern structure in the inner timeframe analysis. Shooting Star pattern will be formed in all the time frames. It is necessary to check the pattern in a higher timeframe to analyze more and it gives more accuracy to trade.

Theory of Shooting Star Pattern

Now we will be analyzing how the market will perform in this pattern. And how to analyze and take trade with this pattern.

Theory of Shooting Star

As you see in the above image the Shooting Star formed in the high trend. Before the pattern formed there was an uptrend. You can see that the market has full control over the buyer and reached the high price. Then the seller came in and pushed the price down, thus forms like a shooting star. This pattern should be formed in a higher timeframe. Then we can analyze this pattern in the inner timeframe to check for structure formation. If the structure are formed as we discussed above, we have a high possibility that this pattern will work in the market. So we can take a Sell Entry in the next running candle.

Confirmation of Shooting Star Pattern

If the next candle of the Shooting Star breaks the previous support trend line, we can get confirmation that the market is going to fall. So we can short the market to make a profit.

Confirmation of Shooting Star

Entry for Shooting Star Pattern

The Entry for the Shooting Star Pattern will be between the running candle open price and the previous candle high price. You can analyze in the inner timeframe to take entry in the sell range as shown below the image.

Entry for Shooting Star Pattern
Entry for Shooting Star

Then as shown above you can take sell entry, as the market will move downside according to our analysis

Stop Loss for Shooting Star Pattern

The Stop Loss for Shooting Star Pattern will be the high price of the Shooting Star

Stop loss for Shooting Star Pattern
Stop loss for Shooting Star

You can also make a Trailing Stop Loss as the market goes below by drawing a resistance line as shown in the above image.

Steps to check before taking the entry with this pattern.

Step 1: Search for the Shooting Star pattern in the higher time frame.

Step 2: Check if the pattern is in a high trend and the prior trend should be an uptrend.

Step 3: Check the Shooting Star structure –> it should be bearish –> the Upper shadow should be 3 times greater than the size of the body with perfect structure formation.

Step 4: Check the structure formation in the inner timeframe of the pattern. If you get the perfect structure move on to the next step.

Step 5: Set entry and stop loss level and execute the trade.

Step 6: Check for confirmation that the previous support line is broken, we also got confirmation that it is on a high trend, and the structure formation of the Shooting Star is perfect so the market will surely move down and we can make a huge profit.

Shooting Star Candlestick Pattern Video Tutorials for Different languages

Shooting Star Candlestick Pattern – A Complete Trading Guide (English)

To get detailed information about the Shooting Star Pattern, Click and watch the video 👇

In this comprehensive video tutorial, learn how to identify and trade the Shooting Star Candlestick Pattern effectively. We’ll dive deep into its structure, theory, and significance in technical analysis, explaining how this pattern signals market indecision and potential trend reversals. Whether you’re a beginner or an experienced trader, this tutorial will help you incorporate the Shooting Star Pattern into your trading strategy to enhance your market predictions and make informed decisions. Watch now to understand how to spot this powerful pattern and use it to boost your trading success!

Shooting Star Candlestick Pattern – முழுமையான வர்த்தக வழிகாட்டி (தமிழில்)

இந்த முழுமையான வீடியோ教程இல், Shooting Star Candlestick Pattern ஐ எவ்வாறு கண்டறிந்து, அதை சரியாக வர்த்தகம் செய்யலாம் என்பதை நீங்கள் கற்றுக்கொள்ளப் போகின்றீர்கள். இந்த வரைபடம் எப்படி சந்தையின் மாற்றங்களை மற்றும் பின்விளைவுகளை குறிக்கின்றது என்பதை விளக்குகிறோம். இது நீங்கள் உங்கள் வர்த்தகத்தை மேம்படுத்த பயன்படுத்தக்கூடிய சக்திவாய்ந்த ஒரு முன்மாதிரியாக இருக்கும். இந்த வீடியோவை தற்போது பாருங்கள், இந்த உத்தரவாதமான முறையை கற்றுக்கொண்டு உங்கள் வர்த்தக வெற்றியை உயர்த்துங்கள்!

Conclusion

Finally for the shooting star pattern the target will be open. You can set according to your risk to reward ratio. The shooting star pattern will best work in the market with above explanation and trading methodology. So learn and practice more in the market to make profit with this pattern. If you want to learn with us, you can reach Classroom Of Traders.

Classroom Of Traders Live Trading in YouTube

Classroom Of Traders Live Trading in YouTube

Classroom Of Traders Live Trading in YouTube

We are Happy to announce that we have started our live trading on Classroom of Traders YouTube channel. We are doing a live trading session on how to make consistent profit in the forex market with our strategy.  

We are making consistent profit in the demo trading account of $10,000. We have started trading from 29/08/2024. Trader name is Fredrick – Senior Research Analyst

❌Disclaimer: Stock market trading carries risks and may not be suitable for everyone. Our content is educational and not financial advice. Always conduct your research and seek advice from professionals before investing.

Do watch our live trading on how to make consistent profit. If you want to know more about the strategy, you can contact Classroom of Traders.

Live Streaming – 14

This live is on 04/11/2024. We made $32343 profit since started, that is almost 323% of the capital with our consistent profit making strategy. You can watch our live on YouTube. Click below to watch.👇🏻

Gold Live Trading on November 4th 2024

Live Streaming – 13

This live is on 25/10/2024. We made $27068 profit since started, that is almost 270% of the capital with our consistent profit making strategy. You can watch our live on YouTube. Click below to watch.👇🏻

Live Streaming – 12

This live is on 24/10/2024. We made $25851 profit since started, that is almost 258% of the capital with our consistent profit making strategy. You can watch our live on YouTube. Click below to watch.👇🏻

🔴LIVE XAUUSD FOREX TRADING – CLASSROOM OF TRADERS ACCOUNT LIVE STREAMING

Live Streaming – 11

This live is on 18/10/2024. We made $16990 profit since started, that is almost 169% of the capital with our consistent profit making strategy. You can watch our live on YouTube. Click below to watch.👇🏻

LIVE XAUUSD FOREX TRADING – CLASSROOM OF TRADERS ACCOUNT LIVE STREAMING

Live Streaming – 10

This live is on 14/10/2024. We made $14390 profit since started, that is almost 140% of the capital with our consistent profit making strategy. You can watch our live on YouTube. Click below to watch.👇🏻

LIVE XAUUSD FOREX TRADING – CLASSROOM OF TRADERS FOREX ACCOUNT LIVE STREAMING

Live Streaming – 9

This live is on 11/10/2024. We made $14390 profit since started, that is almost 140% of the capital with our consistent profit making strategy. You can watch our live on YouTube. Click below to watch.👇🏻

XAUUSD LIVE FOREX TRADING – CLASSROOM OF TRADERS FOREX ACCOUNT LIVE STREAMING

Live Streaming – 8

This live is on 03/10/2024. We made $6195 profit since started, that is almost 61% of the capital with our consistent profit making strategy. You can watch our live on YouTube. Click below to watch.👇🏻

XAUUSD LIVE FOREX TRADING – CLASSROOM OF TRADERS FOREX ACCOUNT LIVE STREAMING

Live Streaming – 7

This live is on 24/08/2024. We made $5453 profit since started, that is almost 54% of the capital with our consistent profit making strategy. You can watch our live trading in YouTube. Click below to watch.👇🏻

XAUUSD LIVE FOREX TRADING – CLASSROOM OF TRADERS FOREX ACCOUNT LIVE STREAMING

Live Streaming – 6

This live is on 23/08/2024. We made $4705 profit since started, that is almost 47% of the capital with our consistent profit making strategy. You can watch our live trading in YouTube. Click below to watch.👇🏻

XAUUSD LIVE FOREX TRADING – CLASSROOM OF TRADERS FOREX ACCOUNT LIVE STREAMING

Live Streaming – 5

This live is on 19/08/2024. We made $4064 profit since started, that is almost 40% of the capital with our consistent profit making strategy. You can watch our live trading in YouTube. Click below to watch.👇🏻

XAUUSD LIVE FOREX TRADING – CLASSROOM OF TRADERS FOREX ACCOUNT LIVE STREAMING

Live Streaming – 4

This live is on 12/08/2024. We made $3641 profit since started, that is almost 36% of the capital with our consistent profit making strategy. You can watch our live trading in YouTube. Click below to watch.👇🏻

XAUUSD LIVE FOREX TRADING – CLASSROOM OF TRADERS FOREX ACCOUNT LIVE STREAMING

Live Streaming – 3

This live is on 04/08/2024. We made $1725 profit within 5 days, that is almost 17% of the capital with our consistent profit making strategy. You can watch our live trading in YouTube. Click below to watch.👇🏻

XAUUSD LIVE FOREX TRADING – CLASSROOM OF TRADERS FOREX ACCOUNT LIVE STREAMING

Live Streaming – 2

This live is on 03/08/2024. We made $830 profit within 3 days, that is almost 3% of the capital with our consistent profit making strategy. You can watch our live trading in YouTube. Click below to watch.👇🏻

XAUUSD LIVE FOREX TRADING – CLASSROOM OF TRADERS FOREX ACCOUNT LIVE STREAMING

Live Streaming – 1

We are Happy to announce that we have started our live trading on Classroom of Traders YouTube channel. We are doing a live trading session on how to make consistent profit in the forex market with our strategy.  

This live is on 02/08/2024. We made $386 profit within 3 days, that is almost 3% of the capital with our consistent profit making strategy. You can watch our live trading in YouTube. Click below to watch.👇🏻

XAUUSD LIVE FOREX TRADING – CLASSROOM OF TRADERS FOREX ACCOUNT LIVE STREAMING

Conclusion:

We are showing the live proof that we are making consistent profit from our strategy. If you want to know and learn about our consistent profit making strategy, you can contact Classroom of Traders.