Inverted Hammer Candlestick Pattern
How to trade using the inverted hammer candlestick pattern?
Inverted hammer candlestick pattern is a price bullish pattern and is a trend reversible pattern in candlestick charting techniques.
Already we were upload video for trend reservable pattern Kindly refer the Classroom Of Traders Youtube Channel.
Structure of Inverted Hammer:
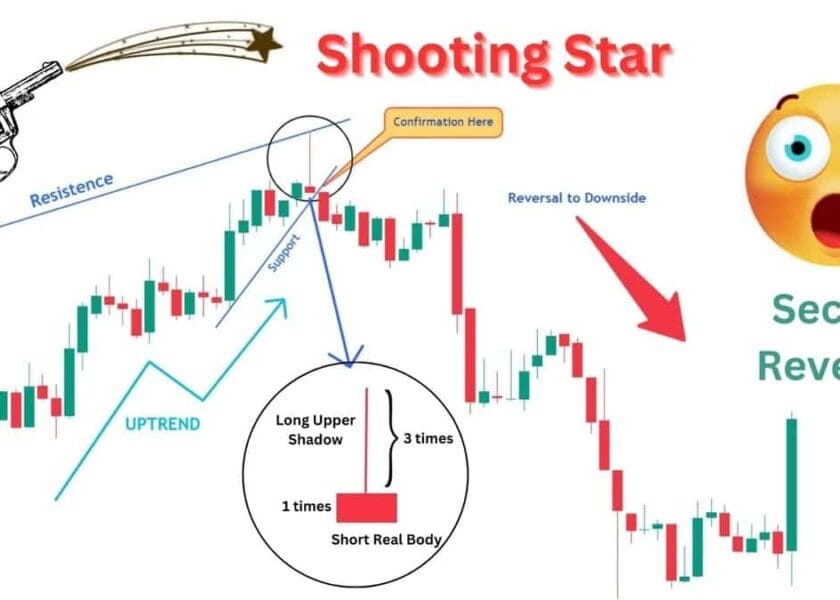
The candle looks like a hammer is in inverted position, as it has a long upper shadow and a short real body at the bottom of the candlestick. Inverted hammer Candlestick Pattern body is three times shorter than shadow. Inverted hammer Candlestick Pattern should be three times greater than the size of the body.
The Inverted hammer form in a lower trend of the chart, this is a sign of a potential bullish reversal pattern in the market. Market will goes up when this pattern appears in the chart.
Theory of Inverted Hammer
The theory of Inverted hammer candlestick pattern form in a lower trend of the chart, this is a sign of a potential bullish reversal pattern in the market. The Inverted hammer candlestick shows sellers came into the market during the period but by the close the selling had been absorbed and buyers had pushed the price back to near the open.
Inverted hammer Candlesticks indicate a potential price reversal to the upside. The price must start moving up and this line you get the confirmation of hammer candle.
Confirmation of Inverted Hammer
Confirmation occurs if the next candle of inverted hammer crossing the line of previous candles of inverted hammer resistance or the closing price of the previous candles.
Ideally, this confirmation candle shows strong buying and the Inverted hammer signaled a possible price reversal to the upside.
Stop-Loss of Inverted hammer Candlestick Pattern
Stop loss can be placed below the low of the Inverted hammer’s shadow.
Time frames of Inverted Hammer
Hammers occur on all time frames, including one-minute charts, daily charts, and weekly charts.
Entry and exit of Inverted hammer
The inverted hammer candlestick pattern entry is between the low price of previous candle of hammer and the high price of hammer candle.
If shadow were found in previous candle of Inverted hammer, entry is between the low price of shadow on the previous candle of hammer and the high price of hammer candlestick pattern.
Example of Inverted Hammer
If the Inverted hammer candlestick pattern confirmation occurs for the target price, and it shows a potential bullish reversal pattern in the market. Market price will go upside. Shown in chart of XAGUSD Commodity illustrates a Inverted Hammer Reversal Pattern after a downtrend
Shows that the market began the day testing to find where demand would enter the market. Silver vs US dollar commodity price eventually found support at the low of the day.
Profiting With Inverted Hammer Candlestick Pattern
Inverted Hammer indicates should be used in conjunction with the Hammer candlestick pattern to determine potential bullish signals.
Target is open. If stop-loss were not triggered in the market, you can take huge profit in the market.
I will upload the video for target using money management system. So, Kindly subscribe my channel for more useful video.


Yes
This is the perfect theory about the inverted hammer. This blog is so clear and very understandable. Thank you for sharing this.